Publications

Decrease in Hospital Uncompensated Care in Michigan, 2015

The Affordable Care Act (ACA) expanded access to health insurance coverage for Michigan residents in 2014 through the creation of the Health Insurance Marketplace and the expansion of the Medicaid program. Since then, Michigan has experienced large decreases in the number of adults who lack health insurance, delay necessary care, and have trouble paying their medical bills.(1)E. Austic, E. Lawton, M. Slowey, M. Riba, and M. Udow-Phillips, Changes in Health Care Cost Barriers under the Affordable Care Act in Michigan (Ann Arbor, MI: Center for Healthcare Research and Transformation, 2017). Hospitals also appear to have reaped the benefits of the ACA’s coverage expansions. Following the expansion of Michigan’s Medicaid program in April 2014, Michigan hospitals experienced a steep drop in uncompensated care costs. In 2015, uncompensated care costs continued to decline, and as uncompensated care’s share of hospital operating expenses decreased, the median hospital operating margin in Michigan improved for the second year in a row. As policymakers debate changes to the Affordable Care Act and Medicaid, it is important to assess the financial gains that Michigan hospitals have received in the first two years of ACA implementation and the potential losses they could incur with a repeal of the ACA.

For an analysis of uncompensated care costs nationwide and a comparison of these trends in several Midwestern states, please see CHRT’s companion piece, Hospital Uncompensated Care in the United States, 2015 – Comparison of Midwest States.

Hospital Uncompensated Care and Financial Trends

Recent studies have documented decreases in uncompensated care and the proportion of uninsured patients in Michigan hospitals after the ACA’s coverage expansion began in 2014. One study used Medicaid cost reports to find that uncompensated care costs for 88 Michigan hospitals(2)88 hospitals in the state of Michigan reported FY2015 data at the time of the study. decreased from $627 million in 2013 to $332.1 million in 2015.(3)T. Buchmueller, H. Levy, S. Nikpay, and J. Rhodes, Healthy Michigan Plan 2015 Report on Uncompensated Care and Insurance Rates, prepared for the Michigan Department of Health and Human Services, December 31, 2016 (accessed 6/12/17).

Another study examined shifts in payer mix in Michigan hospitals following the launch of the Healthy Michigan Plan in April 2014. This study found that the proportion of uninsured patients in Michigan hospitals from April-December 2014 decreased by four percentage points and the proportion of patients with Medicaid coverage increased by 6.5 percentage points compared to the same time periods in 2012 and 2013.(4)M. Davis, A. Gebremariam, and J. Ayanian, “Changes in Insurance Coverage Among Hospitalizeds Nonelderly Adults After Medicaid Expansion in Michigan,” Journal of the American Medical Association, June 21, 2016 (accessed 6/12/17).

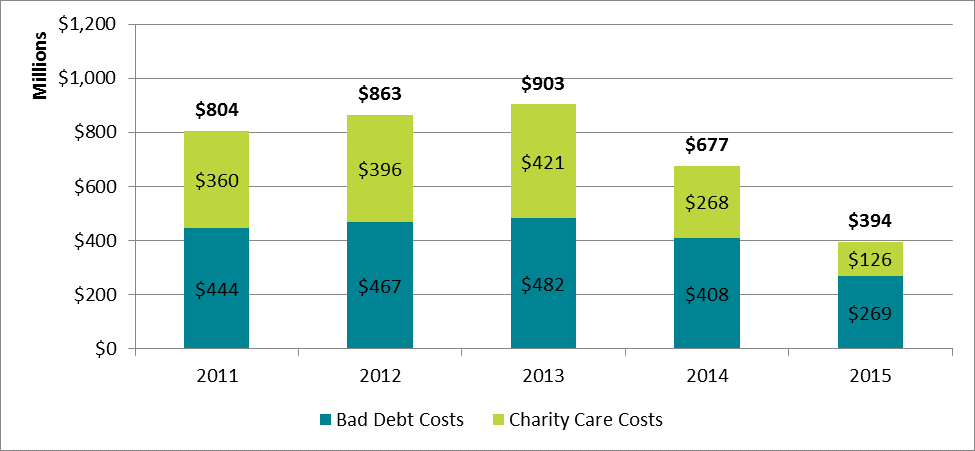
In the present study, CHRT used Medicare cost reports to examine the financial characteristics of 104 hospitals in Michigan. Michigan expanded Medicaid eligibility with the launch of the Healthy Michigan Plan on April 1, 2014. By the end of the year Michigan experienced a sharp decline in uncompensated care, dropping from $903 million in 2013 to $677 million in 2014 (see Figure 1). This drop continued into 2015 as uncompensated care fell to $394 million, a decrease of 56 percent from 2013 levels.

Uncompensated care comprises both charity care costs and bad debt costs. The effect of the Medicaid expansion was larger for the charity care portion of uncompensated care compared to the bad debt portion. Charity care expenses for hospitals decreased by 70 percent from 2013 to 2015.

Figure 1: Hospital Uncompensated Care Costs in Michigan, by Bad Debt and Charity Care, 2011–2015

Figure 1: Hospital Uncompensated Care Costs in Michigan, by Bad Debt and Charity Care, 2011–2015

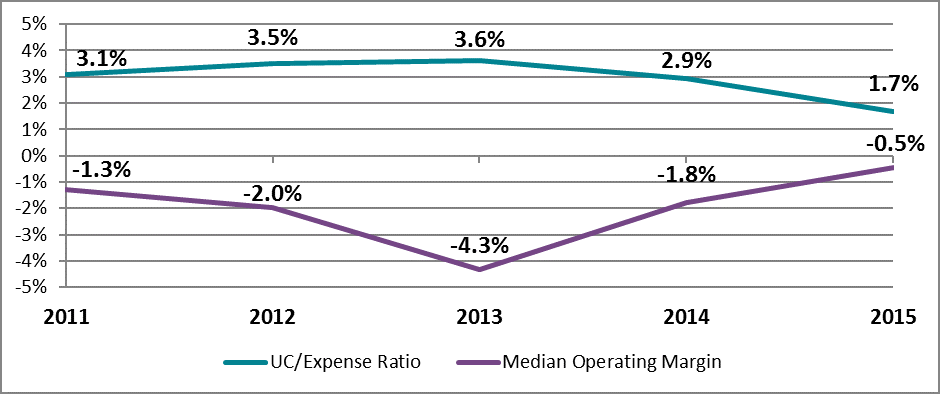
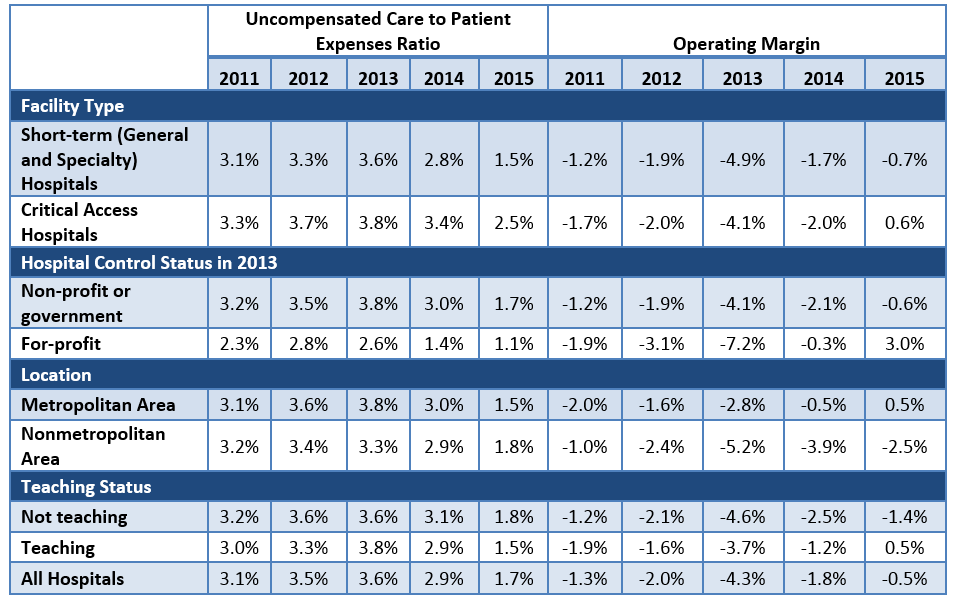
From 2013 to 2015, Michigan hospitals generally experienced improved overall financial outcomes as well as decreased uncompensated care burdens. Uncompensated care’s share of hospital expenses fell from 3.6 percent for the median hospital in 2013 to 1.7 percent in 2015 after increasing in the years prior to Medicaid expansion (see Figure 2). However, hospitals had different levels of uncompensated care burdens and the effects of coverage expansion varied by specific hospital characteristics (see Appendix).

Coinciding with the decline in uncompensated care costs, the median hospital operating margin (net profits from patient care services) increased from -4.3 percent in 2013 to -0.5 percent in 2015. The ACA includes several quality improvement programs, such as penalties for hospital readmissions, which affect Medicare reimbursement. While these types of penalties may have had a negative effect on the profitability of certain hospitals, many hospitals experienced substantial gains in profitability in 2015.

Figure 2: Median Hospital Financial Indicators in Michigan, 2011–2015

Figure 2: Median Hospital Financial Indicators in Michigan, 2011–2015

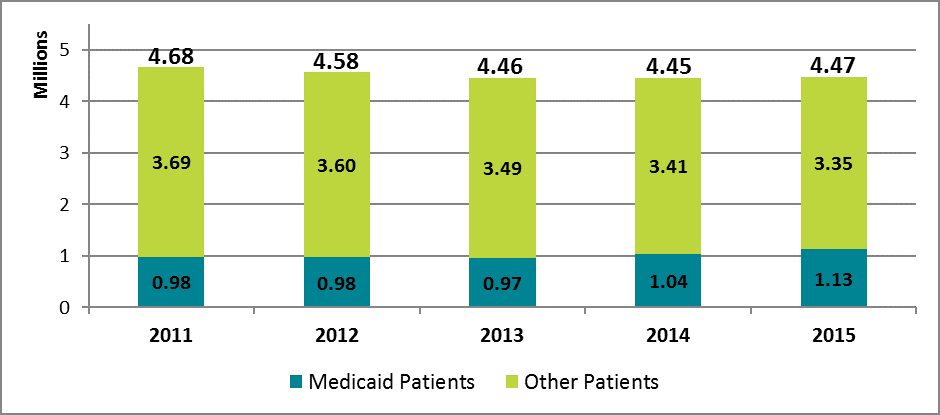
From 2011 to 2013 the number of inpatient days and outpatient visits at Michigan hospitals decreased from 4.68 million to 4.46 million (see Figure 3). In 2015, Medicaid volume increased by 16 percent to 1.13 million inpatient days and outpatient visits, while volume for other payers decreased by 4 percent. Overall volume has remained nearly unchanged from 2013 to 2015. Medicaid’s share of total patient volume increased from 21.7 percent in 2013 to 25.2 percent in 2015.

Figure 3: Hospital Inpatient Days and Outpatient Visits for Michigan Hospitals by Payer, 2011–2015

Figure 3: Hospital Inpatient Days and Outpatient Visits for Michigan Hospitals by Payer, 2011–2015

Conclusion

Hospital financial performance in Michigan has improved in the two years since the implementation of the ACA’s coverage expansions in 2014. Michigan continued to experience a decline in hospital uncompensated care costs in 2015 as hospitals saw fewer uninsured patients and a higher proportion of patients covered by Medicaid. Overall hospital operating margins also improved in 2015. Medicaid expansion appears to have had a positive effect on hospitals’ uncompensated care costs and overall margins since the launch of the Healthy Michigan Plan in 2014. With policymakers currently debating changes to Medicaid and the future of the Affordable Care Act, it will be important to monitor the connection between the coverage expansions created under the law and the financial performance of health care providers. Policy changes that reverse the ACA’s coverage gains could also affect hospitals’ financial status.

Data and Methodology

We extracted hospital data on uncompensated care and other facility characteristics from publicly available cost reports submitted by hospitals to the Centers for Medicare and Medicaid Services (CMS) via the Healthcare Cost Report Information System (HCRIS). Data include reports collected by December 31, 2016, which were released on January 19, 2017. For this analysis, we restricted the set of hospitals to short-term acute and critical access hospitals that submitted complete reports for each year from 2011 through 2015. This eliminated rehabilitation, long-term, psychiatric, children’s, and other specialty hospitals that have high nonresponse rates or are not largely affected the ACA’s Medicaid expansion. The resulting data set includes 3,474 hospitals nationwide and 104 in Michigan.

Hospitals submit worksheet S-10 as part of their cost report that breaks down their uncompensated care costs into their separate sources. In our analysis, we define uncompensated care as the sum of charity care (care delivered with no expectation of payment) and bad debt (care that is billed but no payment is received), but underpayments from public payers (Medicare, Medicaid, and the Children’s Health Insurance Program) were excluded. The use of cost report data for uncompensated care research is still relatively new, and not all responses from hospitals are audited by CMS. However, MedPAC has supported using worksheet S-10 to directly measure uncompensated care costs.(5)Medicare Payment Advisory Commission. Report to the Congress: Medicare Payment Policy. March 2016. http://www.medpac.gov/docs/default-source/reports/march-2016-report-to-the-congress-medicare-payment-policy.pdf (accessed 3/17/16). Data for inpatient days and outpatient visits were extracted from worksheet S-3, part 1, and data on operating margins were extracted from worksheet G-3 of the cost reports.

Cost reports submitted to hospitals are based on individual hospitals’ fiscal years, which have varying beginning and end dates. To generate comparable time-series measures, we converted hospital fiscal year measures to calendar year estimates by combining the portion of each fiscal year that fell within a given calendar year. Uncompensated care amounts were converted from charges to costs using hospital-specific cost-to-charge ratios calculated in the cost reports, and all financial measures were adjusted for inflation to 2015 dollars. Facilities that reported outlier uncompensated care amounts compared to their historic trend were dropped from the study.

Hospitals were identified as for-profit, nonprofit, or government-owned based on control status data from the 2013 American Hospital Association annual survey.(6)American Hospital Association. Annual Survey Database: http://www.aha.org/research/rc/stat-studies/data-and-directories.shtml (accessed 3/17/16). Metropolitan status was determined based on the U.S. Department of Agriculture’s rural-urban continuum codes for 2013,(7)US Department of Agriculture, Economic Research Service, Rural-Urban Continuum Codes: http://www.ers.usda.gov/data-products/rural-urban-continuum-codes.aspx (accessed 3/17/16). and hospitals were identified as teaching institutions if they indicated in their cost reports that they train residents as part of an approved graduate medical education program.

Appendix

Figure A-1: Median Financial Indicators for Michigan Hospitals by Select Characteristics, 2011–2015

Figure A-1: Median Financial Indicators for Michigan Hospitals by Select Characteristics, 2011–2015


References

References
1 E. Austic, E. Lawton, M. Slowey, M. Riba, and M. Udow-Phillips, Changes in Health Care Cost Barriers under the Affordable Care Act in Michigan (Ann Arbor, MI: Center for Healthcare Research and Transformation, 2017).
2 88 hospitals in the state of Michigan reported FY2015 data at the time of the study.
3 T. Buchmueller, H. Levy, S. Nikpay, and J. Rhodes, Healthy Michigan Plan 2015 Report on Uncompensated Care and Insurance Rates, prepared for the Michigan Department of Health and Human Services, December 31, 2016 (accessed 6/12/17).
4 M. Davis, A. Gebremariam, and J. Ayanian, “Changes in Insurance Coverage Among Hospitalizeds Nonelderly Adults After Medicaid Expansion in Michigan,” Journal of the American Medical Association, June 21, 2016 (accessed 6/12/17).
5 Medicare Payment Advisory Commission. Report to the Congress: Medicare Payment Policy. March 2016. http://www.medpac.gov/docs/default-source/reports/march-2016-report-to-the-congress-medicare-payment-policy.pdf (accessed 3/17/16).
6 American Hospital Association. Annual Survey Database: http://www.aha.org/research/rc/stat-studies/data-and-directories.shtml (accessed 3/17/16).
7 US Department of Agriculture, Economic Research Service, Rural-Urban Continuum Codes: http://www.ers.usda.gov/data-products/rural-urban-continuum-codes.aspx (accessed 3/17/16).

Comparing Key Provisions: Affordable Care Act, American Health Care Act, and Better Care Reconciliation Act

An image of the Capitol building, where the Better Care Reconciliation Act has been proposed.Editor’s Note: CHRT revised the following table (originally published June 27, 2017) to reflect both the U.S. Senate’s July 13 revision of its Better Care Reconciliation Act (BCRA) and the Congressional Budget Office’s score of the revised BCRA.  

On June 22, 2017, Senate Republicans released a discussion draft of the Better Care Reconciliation Act, their proposal to repeal and replace the Affordable Care Act (ACA). The Senate draft retains a similar overall structure as the American Health Care Act, which passed the U.S. House of Representatives in May 2017, but includes some notable differences. The following table compares key provisions of the ACA, American Health Care Act, and Better Care Reconciliation Act. It compares them across several categories: Ensuring Continuous Coverage, Tax Credits for Individual Market Coverage, Cost-Sharing Reductions, Medicaid Expansion, Medicaid Funding Structure, Health Savings Accounts, Private Insurance Market Regulations, Market Stability and Risk Pool, Taxes and Fees, Impacts on Coverage and Premiums, and Impacts on Federal Budget.

For example, for the category of Ensuring Continuous Coverage, the ACA requires an individual with a lapse in coverage to pay an individual mandate penalty of $695 or 2.5% of income above $10,000. The American Health Care Act repeals the ACA’s individual mandate penalty and instead requires individuals with a lapse in coverage to pay 30% higher premiums for one year upon re-enrolling in individual coverage. The Better Care Reconciliation Act also repeals the ACA’s individual mandate penalty, and subjects individuals with a lapse in coverage to a six-month waiting period before re-enrolling.

This document reflects the revised Better Care Reconciliation Act as of July 13, 2017. CHRT will update this table if the Senate votes to approve the motion to proceed.

READ THE BRIEF

Michigander’s satisfaction with health care coverage has increased since ACA implementation

Two small blocks, one with a smiley face drawn in black and one with a frown face. A hand is moving the smiling block forward to show how health care satisfaction has increased since the implementation of the ACA.Data from the Center for Healthcare Research and Transformation’s (CHRT) Cover Michigan Survey describes the rate of satisfaction with health care coverage before and after implementation of the Patient Protection and Affordable Care Act (ACA).

Satisfaction with health care coverage in the state of Michigan has increased since the implementation of the ACA. In 2015, 57 percent of Michiganders reported that they were satisfied with their health coverage, which is in alignment with national rates of satisfaction with health care. This represents a significant increase from the 51 percent of respondents who reported they were satisfied with their health care coverage in 2012 before the ACA took effect. In 2014, 52% of Michigan residents reported that they were satisfied with their health care coverage.

The Cover Michigan Survey data presented in this brief were produced from a series of survey questions added to the Michigan State University Institute for Public Policy and Social Research quarterly State of the State Survey. Further methodology detail can be found on CHRT’s website. In 2015, the survey was fielded between October and December 2015 and included a sample of 972 Michigan adults, with a 17.0 percent response rate. In 2014, the survey was fielded between September and November 2014 and included a sample of 1,002 Michigan adults with a 20.2 percent response rate. In 2012, the survey was fielded between August and October 2012 and included a sample of 1,018 Michigan adults, with a 31.6 percent response rate.

READ THE BRIEF


ACA Repeal and Replacement: Proposals and Action

Yellow road sign reading "Affordable Care Act" with a red x over the words to indicate repealing the ACA..Beginning last month, both U.S. President Donald Trump and the U.S. Congress began taking steps to repeal and replace the Affordable Care Act (ACA). However, a single replacement strategy has not yet emerged.

In a new one-page fact sheet, CHRT summarizes the most developed ACA repeal and replacement proposals offered to date and outlines the tentative replacement process.

You can also review CHRT’s companion piece, Select Affordable Care Act Replacement Plans and Implications, for a detailed table summarizing the key features and implications of the most developed full ACA repeal and replacement plans offered to date.

The face sheet summarizes three full replacements for the ACA: the House Republicans’ “A Better Way” proposal, Rep. Tom Price’s “Empowering Patients First Act”, and the Burr-Hatch-Upton “Patient Choice, Affordability, Responsibility, and Empowerment Act”. It also summarizes one partial replacement, the Cassidy-Collins “Patient Freedom Act”.

The fact sheet also details the process to repeal and replace the ACA. We summarize President Trump’s January 20 Executive Order and the 2017 Congressional Action. On January 3, the Senate Budget Committee created a budget resolution to provide framework for a partial ACA repeal using budget reconciliation. On January 12 the resolution received full Senate approval and on January 13 it received full House approval.

The House and Senate committees intended to have draft actual reconciliation legislation by January 27, but this has been delayed. April 15 is the prescribed deadline under current rules for the House and Senate to adopt annual budget resolutions, but this is generally not enforced. June 15 is the prescribed deadline to enact any reconciliation legislation, but this is also generally not enforced.

READ THE SHEET

The Effects of the Affordable Care Act on Federally Qualified Health Centers in Michigan

A FQHC building with "Health Center" written on it.Federally Qualified Health Centers (FQHCs) form a critical part of the health care safety net, providing essential primary care services to people with limited health care access. The Affordable Care Act (ACA) increased FQHC funding from 2010 through 2015 and significantly expanded the insured population beginning in 2014.

The purpose of this brief is to describe how the overall experience of Michigan FQHCs has changed with ACA implementation, based on analysis of 2008–2015 Uniform Data System data, 2016 Health Resources and Services Administration (HRSA) Delivery Site data, as well as data from interviews with FQHC leaders across the state.

Key findings include:

  • Many health centers have used increased grant funding to provide new services and expand existing ones, such as dental and mental health services.
  • Coverage expansion, particularly through the Healthy Michigan Plan (Michigan’s Medicaid expansion program), has substantially decreased the number of uninsured patients. Overall, the uninsured share of the Michigan FQHC population dropped by nearly 50 percent between 2013 and 2015, falling from 31 percent to 16 percent.
  • Although specialty referrals are easier for insured patients, such referrals remain a major challenge in some regions and specialties, especially for Medicaid patients. Some of the more difficult services to find include those in psychiatry, rheumatology, orthopedics, and neurology.
  • FQHCs have been developing new partnerships and strategies to help address the remaining needs of their patients. This includes partnerships with hospitals and community mental health organizations as well as partnerships with specialists outside their geographic area to provide telehealth services.
  • FQHCs still experience many barriers to growth, including challenges with hiring necessary providers, such as psychiatrists, as well as adequate funding for particular types of services, such as oral surgery, or for personnel, such as community health workers.

READ THE REPORT

Prevalence, medication, and therapy variations for child Attention Deficit Hyperactivity Disorder (ADHD) in Michigan

A white child with ADHD looks bored at a school desk.This brief examines ADHD treatment for Michigan children (aged 4 to 17), including medication and behavioral therapy, and regional variation in treatment patterns.

Attention deficit hyperactivity disorder (ADHD) is the most common neurobiological disorder among children in the U.S. Hyperactivity, impulsiveness, and difficulty staying focused or paying attention are common symptoms of ADHD, and may continue into adulthood. Children with ADHD will often have other co-occurring mental health conditions or learning disabilities and tend to have more school-based and health care needs than children without ADHD.

Research has established medication and behavioral therapy as the most effective treatments for ADHD. Medication for ADHD, most commonly stimulant medications such as methylphenidate (e.g., Ritalin) or amphetamines (e.g., Adderall), and behavioral therapy, including psychotherapy or social skills training, can be prescribed alone or in combination. In the American Academy of Pediatrics’ (AAP) most recent guidelines for ADHD diagnosis, evaluation, and treatment, recommendations vary by age group. Behavioral therapy is recommended first for preschool children, supplemented by ADHD medication if therapy does not improve symptoms. For older children, the AAP recommends ADHD medications with or without behavioral therapy. Combination therapy is preferred, particularly for elementary children.

In practice, many children treated for ADHD are prescribed only ADHD medication; many fewer receive behavioral therapy. ADHD medication can reduce symptoms and behaviors, but has side effects—such as poor appetite or difficulty sleeping— and may not be a cure-all in the long term. Behavioral therapy can improve a child’s immediate behaviors and develop skills that can carry into adulthood. Recent evidence indicates that behavioral therapy can be more effective as a first line treatment for elementary school children than starting with medication. A recent U.S. Centers for Disease Control and Prevention (CDC) report on ADHD treatment for younger children found that medication treatment was more common than psychological services.

Key findings include:

  • In 2011, 8.8 percent (5.1 million) of U.S. children aged 4 to 17 were reported by parents as having an ADHD diagnosis. Approximately 6.3 percent (approximately 17,000 patients) of privately insured children in the Michigan study group had a claim related to ADHD in 2013. ADHD among children in Michigan ranged from 4.6 percent of children in the Dearborn Hospital Referral Region (HRR) to 7.3 percent in the St. Joseph and Muskegon HRRs.
  • Once diagnosed with ADHD, most Michigan children were prescribed ADHD medication alone (52.5 percent), which was higher than the national rate (43.3 percent).
  • The rate of ADHD medication alone to treat children with ADHD varied by region within Michigan, with Royal Oak at 44.5 percent compared to Petoskey at 67.5 percent.
  • About 9.7 percent of Michigan children received behavioral therapy alone for ADHD, and 30.7 percent received both ADHD medication and behavioral therapy.
  • Compared to national treatment rates, Michigan children with ADHD generally had lower rates of treatment via behavioral therapy only and higher rates of treatment through ADHD medication only across all age groups, with the exception of the youngest age group (aged 4 to 5).
  • Rates of behavioral therapy among children with ADHD varied considerably by geography in Michigan. Only 4.3 percent of children diagnosed with ADHD in the Petoskey HRR received behavioral therapy alone, while 13.5 percent of children received behavioral therapy alone in the Royal Oak HRR, the highest region in the state. Lower rates of behavioral therapy may be due to challenges in accessing mental health providers in more rural regions of the state.
  • Rates of ADHD treatment consisting of both medication and behavioral therapy, as generally recommended by the American Academy of Pediatrics, ranged from 18.4 percent in Petoskey to 36.1 percent in Royal Oak.

READ THE REPORT

Cover Michigan 2014 Survey: Satisfaction with Health Coverage in Michigan

Michigan doctor selecting a rating out of five stars as on a survey.The third open enrollment period for individual coverage on Michigan’s health insurance marketplace began on November 1, 2015, and will continue until January 31, 2016.(1)U.S. Centers for Medicare & Medicaid Services. November 2015. 2016 health insurance dates and deadlines.https://www.healthcare.gov/quick-guide/dates-and-deadlines/ (accessed 11/4/15) The average Michigan consumer will have 64 plans to choose from during the 2015 open enrollment period.(2)J. Fangmeier, 2015 Marketplace Rate Analysis (Ann Arbor, MI: Center for Healthcare Research & Transformation, Nov. 2015). Nationwide, 31 percent of consumers with marketplace coverage in both 2014 and 2015 switched plans during last year’s open enrollment period(3) T. DeLeire and C. Marks. Department of Health & Human Services. October 2015. Consumer Decisions Regarding Health Plan Choices in the 2014 and 2015 Marketplaces. http://aspe.hhs.gov/sites/default/files/pdf/134556/Consumer_decisions_10282015.pdf (accessed 11/4/15).

This brief examines how factors influencing health plan selection, both on and off the marketplace, were related to consumer satisfaction with insurance coverage. Our analyses suggest that when selecting a health plan during open enrollment, consumers may be happier with their coverage if they ensure that their plan includes their current primary care provider rather than looking for the plan with the widest network. Comparison shopping among plans at similar price points and looking for value instead of price alone may also lead to increased health plan satisfaction.

The brief is based on data from the Center for Healthcare Research & Transformation’s 2014 Cover Michigan Survey of Michigan adults, fielded between September and November 2014. Detailed methodology is available at https://chrt.org/publication/health-plan-selection-factors-influencing-michiganders-choice-of-health-insurance/.

Key findings include:

  • Consumers for whom price played a major role when selecting a health plan were less likely to be satisfied with their plans than those for whom price was a less important consideration.
  • Consumers whose insurance did not include their primary care provider were far less likely to be satisfied with their coverage than those whose providers were included in their plans.

Findings from the 2014 Cover Michigan Survey

Forty-nine percent of respondents who reported that premium costs were a very important consideration when selecting a health insurance plan were satisfied with their plan (defined as having rated it as ‘excellent’ or ‘very good’), compared to 61 percent of respondents for whom premium costs were not such an important consideration. Similar differences existed for those who reported that deductible, copay, and coinsurance costs had been very important considerations in their selection of a plan, but respondents for whom the number of physicians in the plan had been a very important consideration were equally likely to report being satisfied with their coverage as those for whom this had not been as important factor FIGURE 1.

Figure 1: Percent of respondents satisfied with coverage, by importance of cost and network size in plan selection

Figure1

Source: CHRT Cover Michigan Survey 2014.

Only 21 percent of respondents who reported having had to change health care providers in the previous year because their provider was not included in their plan were satisfied with their coverage, compared to 54 percent of respondents whose insurance did not cause them to switch providers FIGURE 2.

Figure 2: Satisfaction with coverage, by insurance inclusion of provider
Figure2

Source: CHRT Cover Michigan Survey 2014.

READ THE BRIEF

References

References
1 U.S. Centers for Medicare & Medicaid Services. November 2015. 2016 health insurance dates and deadlines.https://www.healthcare.gov/quick-guide/dates-and-deadlines/ (accessed 11/4/15)
2 J. Fangmeier, 2015 Marketplace Rate Analysis (Ann Arbor, MI: Center for Healthcare Research & Transformation, Nov. 2015).
3 T. DeLeire and C. Marks. Department of Health & Human Services. October 2015. Consumer Decisions Regarding Health Plan Choices in the 2014 and 2015 Marketplaces. http://aspe.hhs.gov/sites/default/files/pdf/134556/Consumer_decisions_10282015.pdf (accessed 11/4/15).

Flu Vaccination in Michigan: Opportunities for Improvement

Person receiving a flu vaccination.Introduction

Approximately 6,000 Americans die of influenza every year,(1)Centers for Disease Control and Prevention, “Estimates of Deaths Associated with Seasonal Influenza — United States, 1976–2007,” Morbidity and Mortality Weekly Report (MMWR), Aug. 27, 2010, 59(33): 1057–62: http://www.cdc.gov/mmwr/preview/mmwrhtml/mm5933a1.htm (accessed 6/25/15) and almost 800 people were hospitalized during the 2014–2015 flu season in the four Michigan counties that report flu hospitalizations (Clinton, Eaton, Genesee, and Ingham counties).(2)Michigan Department of Health & Human Services, “Influenza Surveillance Report for the Week Ending June 13, 2015,” MI Flu Focus, Influenza Surveillance Updates, (Lansing, MI: Michigan Department of Health & Human Services, Bureaus of Epidemiology and Laboratories, June 24, 2015), 12(23): http://www.michigan.gov/documents/mdch/MIFF_6-24-15_492747_7.pdf (accessed 6/25/15). Although the Centers for Disease Control and Prevention (CDC) Advisory Committee on Immunization Practices recommends that all adults and children over the age of six months receive an annual flu vaccination,(3)Centers for Disease Control and Prevention, Advisory Committee on Immunization Practices (ACIP) Reaffirms Recommendation for Annual Influenza Vaccination (Atlanta, GA: CDC, Feb. 26, 2015): http://www.cdc.gov/media/releases/2015/s0226-acip.html (accessed 6/25/15). only 42 percent of American adults were vaccinated against the flu during the 2013–2014 flu season.(4)Centers for Disease Control and Prevention, Flu Vaccination Coverage, United States, 2013–14 Influenza Season (Atlanta, GA: CDC, September 14, 2014): http://www.cdc.gov/flu/fluvaxview/coverage-1314estimates.htm (accessed 9/1/15). Michigan’s vaccination rate during the 2013–2014 flu season was slightly lower than the national average at 40 percent.(5)Centers for Disease Control and Prevention, 2013–14 State, Regional, and National Vaccination Report II (Atlanta, GA: CDC, N.D.): http://www.cdc.gov/flu/fluvaxview/reportshtml/reporti1314/reportii/index.html (accessed 9/1/15). Effectiveness of the flu vaccine varies greatly from year to year based on the annual vaccine’s match with strains of flu virus circulating at the time as well as other factors. Nevertheless, even the 2014–2015 vaccine, which was not as well matched to the predominant strains during that season as some previous vaccines, was able to reduce the odds of influenza infection by almost one-fourth among those vaccinated in the United States.(6)Centers for Disease Control and Prevention, “Early Estimates of Seasonal Influenza Vaccination Effectiveness—United States, January 2015,” Morbidity and Mortality Weekly Report (MMWR), Jan. 16, 2015, 64(01): 10–15: http://www.cdc.gov/mmwr/preview/mmwrhtml/mm6401a4.htm (accessed 6/25/15).

Michiganders insured through Medicaid or the Healthy Michigan Plan (the state’s expanded Medicaid program) are able to receive annual flu vaccination without a copay.(7)Michigan Department of Community Health, MSA Bulletin 10-30 (Lansing, MI: Michigan Department of Community Health, Medical Services Administration, Aug. 10, 2010): https://michigan.fhsc.com/Downloads/ MSA_10-30_330003_7.pdf (accessed 8/20/15). The Healthy Michigan Plan encourages beneficiaries to choose vaccination by reducing annual out-of-pocket contributions by 50 percent for those with an annual household income above the federal poverty level who complete a Health Risk Assessment with their primary care office/clinic and identify a health behavior goal such as receiving a flu shot.(8)State of Michigan, Healthy Michigan Plan, MI Health Account (Lansing, MI: Healthy Michigan Plan, 2015): http://www.michigan.gov/healthymiplan/0,5668,7-326-67957_69564—,00.html (accessed 8/20/15). Because Healthy Michigan Plan beneficiaries whose income is below the federal poverty level are not required to make out-ofpocket contributions, many plans instead provide them with a $50 prepaid card or gift card for completing the Health Risk Assessment.(9)U nitedHealthcare, Healthy Michigan Plan – Health Risk Assessment
Provider FAQ’s (Southfield, MI: United Healthcare, April 2014): http://www.uhccommunityplan.com/content/dam/communityplan/healthcareprofessionals/providerinformation/MI-Provider-Information/MI_Healthy_Incentive_FAQ.pdf (accessed 8/20/15).
,(10)HealthPlus Partners Healthy Michigan, HealthPlus Partners will reward you for taking steps toward getting and staying healthy! (N.P.: HealthPlus, April 8, 2014): https://www.healthplus.org/uploadedFiles/PDFs/Healthy_Michigan/HMP%20HRA%20Member%20Incentives%20Letter%20050514.pdf (accessed 8/20/15). As one of the Affordable Care Act’s preventive health services, annual flu vaccinations are also available without a copay or deductible to many Michiganders with private insurance.(11)U .S. Centers for Medicare & Medicaid Services, Preventive Health Services for Adults (Baltimore, MD: U.S. Centers for Medicare and Medicaid Services, N.D.): https://www.healthcare.gov/preventive-care-benefits/ (accessed 6/25/15). This brief examines the factors affecting flu vaccination in Michigan and how current and future policy initiatives could improve vaccination rates.

The brief is based on data from the Center for Healthcare Research & Transformation’s 2014 Cover Michigan Survey of Michigan adults, fielded between September and November 2014. All reported differences are statistically significant at the p ≤ 0.05 level.

Key Findings

  • Less than half (45 percent) of Michigan adults surveyed reported having received a flu vaccination in the past 12 months, a proportion similar to the national average.
  • Only 37 percent of African-American respondents reported having been vaccinated against the flu in the 12 months prior to the survey, compared to 47 percent of white respondents.
  • Women were more likely than men to report having received the flu vaccine: 48 percent of women reported having been vaccinated as compared to only 42 percent of men.
  • About one in three respondents under the age of 40 (34 percent) reported having been vaccinated, compared to more than two-thirds (70 percent) of those over 65.
  • Only 22 percent of respondents with Medicaid and 19 percent of uninsured respondents reported having received the flu vaccine in the past 12 months, about half the rate of respondents with employer-sponsored or individually purchased insurance.
  • Forty-eight percent of respondents who usually sought care at a doctor’s office reported having been vaccinated, compared to only 35 percent of those whose usual source of care was an urgent care clinic and 30 percent of those whose usual source of care was an emergency department.

    Demographic Predictors of Vaccination

Forty-five percent of Michigan residents surveyed reported having received a flu vaccination in the 12 months before the survey. Forty-seven percent of white respondents reported having been vaccinated in the year leading up to the survey, compared to only 37 percent of African-American respondents.

Only one-third of those whose income was less than $30,000 had been vaccinated, compared to half of those with an income above $30,000. Figure 1

CT958-CMS-Influenza-FIG1

Perceived household financial status had an even stronger relationship with flu vaccination than did reported household income. Those who rated their household financial status as “excellent” were more than twice as likely to report having received a flu shot than were those who rated their household financial status as “poor.” Figure 2

CT958-CMS-Influenza-vFIG2

Michiganders over the age of 65 were twice as likely to report having received a flu vaccine as those under 40. Only 34 percent of those between the ages of 18 and 39 reported having been vaccinated in the past year. Figure 3

CT958-CMS-Influenza-vFIG3


Insurance Status and Vaccination

Survey respondents reported wide variations in vaccination rates varied based on insurance status. Only 19 percent of uninsured respondents reported that they had been vaccinated in the past year, compared to 48 percent of insured respondents. Michiganders with Medicare were most likely to report having received the flu vaccine, while those who were uninsured or had Medicaid were least likely to report having been vaccinated. Respondents with employer-sponsored or individually purchased insurance were almost twice as likely as those with Medicaid to report having received a flu vaccine. Less than one-quarter of respondents with Medicaid reported having been vaccinated in the 12 months prior to the survey. Figure 4

CT958-CMS-Influenza-FIG4


Source of Care and Vaccination

Half of Michiganders who reported that they had a primary care provider received a flu vaccine, compared to only 28 percent of respondents who did not have a primary care provider. Those who reported that they usually went to a doctor’s office when they were sick or needed medical advice were more likely to have been vaccinated than those who reported usually receiving care at an emergency department or urgent care clinic. Figure 5

CT958-CMS-Influenza-FIG5


Conclusion

Despite recommendations that all individuals six months and older be vaccinated against the flu each year, less than half of Michigan adults surveyed reported having been vaccinated in the year leading up to this survey. Michigan residents whose income was less than $30,000 per year, those without a primary care provider and/or who relied on urgent care facilities or emergency departments for care, and those who had Medicaid or were uninsured were least likely to have been vaccinated. The low vaccination rates among these groups suggest a need for targeted future interventions. These data were collected too early in 2014 to fully reflect vaccination rates during the 2014–2015 flu season and therefore do not assess effectiveness of the Healthy Michigan Plan’s potential to effect changes in vaccination rates. It is possible that Michigan vaccination rates may increase as more Michiganders gain insurance coverage through the Medicaid expansion and the insurance marketplace, and as participation in the Healthy Michigan Plan’s incentive program expands.

Methodology

The survey data presented in this brief were produced from a series of survey questions added to the Michigan State University Institute for Public Policy and Social Research (IPPSR) quarterly State of the State Survey. The survey was fielded between September and November 2014 and included a sample of 1,002 Michigan adults, with a 20.2 percent response rate. The margin of error for the entire sample was ±3.9 percent. The sampling design, a random stratified sample based on regions within the state, was a telephone survey of Michigan residents conducted via landline and cellular phones.

For analytical purposes, survey data were weighted to adjust for the unequal probabilities of selection for each stratum of the survey sample (for example, region of the state, listed vs. unlisted telephones). Additionally, data were weighted to adjust for non-response based on age, gender, and race according to population distributions from 2009–2013 American Community Survey data. Respondents who reported both Medicare and Medicaid coverage or who reported coverage through the Healthy Michigan Plan were considered Medicaid recipients for the purpose of this analysis. Due to the timing of the survey, reported vaccination may have occurred during either the 2013–2014 flu season or during the 2014–2015 flu season. Results were analyzed using SAS 9.3 software. Statistical significance of bivariate relationships was tested using z tests or chi-square tests for independence. All comparison tables are statistically significant at the p ≤ 0.05 level unless otherwise noted. A full report of the IPPSR State of the State Survey methodology can be found at: http://ippsr.msu.edu/soss/.

READ THE REPORT


Suggested Citation: Mary L. Smiley, Melissa Riba, and Marianne Udow-Phillips, Flu Vaccination in Michigan:
Opportunities for Improvement. Cover Michigan Survey 2014 (Ann Arbor, MI: Center for Healthcare Research & Transformation, October 2015).

Acknowledgements: The staff at the Center for Healthcare Research & Transformation would like to thank Thomas Buchmueller, Matthew M. Davis, Robert Goodman, Helen Levy, Renuka Tipirneni, and the staff of the Institute for Public Policy and Social Research (IPPSR) at Michigan State University for their assistance with the design and analysis of the survey.

References

References
1 Centers for Disease Control and Prevention, “Estimates of Deaths Associated with Seasonal Influenza — United States, 1976–2007,” Morbidity and Mortality Weekly Report (MMWR), Aug. 27, 2010, 59(33): 1057–62: http://www.cdc.gov/mmwr/preview/mmwrhtml/mm5933a1.htm (accessed 6/25/15)
2 Michigan Department of Health & Human Services, “Influenza Surveillance Report for the Week Ending June 13, 2015,” MI Flu Focus, Influenza Surveillance Updates, (Lansing, MI: Michigan Department of Health & Human Services, Bureaus of Epidemiology and Laboratories, June 24, 2015), 12(23): http://www.michigan.gov/documents/mdch/MIFF_6-24-15_492747_7.pdf (accessed 6/25/15).
3 Centers for Disease Control and Prevention, Advisory Committee on Immunization Practices (ACIP) Reaffirms Recommendation for Annual Influenza Vaccination (Atlanta, GA: CDC, Feb. 26, 2015): http://www.cdc.gov/media/releases/2015/s0226-acip.html (accessed 6/25/15).
4 Centers for Disease Control and Prevention, Flu Vaccination Coverage, United States, 2013–14 Influenza Season (Atlanta, GA: CDC, September 14, 2014): http://www.cdc.gov/flu/fluvaxview/coverage-1314estimates.htm (accessed 9/1/15).
5 Centers for Disease Control and Prevention, 2013–14 State, Regional, and National Vaccination Report II (Atlanta, GA: CDC, N.D.): http://www.cdc.gov/flu/fluvaxview/reportshtml/reporti1314/reportii/index.html (accessed 9/1/15).
6 Centers for Disease Control and Prevention, “Early Estimates of Seasonal Influenza Vaccination Effectiveness—United States, January 2015,” Morbidity and Mortality Weekly Report (MMWR), Jan. 16, 2015, 64(01): 10–15: http://www.cdc.gov/mmwr/preview/mmwrhtml/mm6401a4.htm (accessed 6/25/15).
7 Michigan Department of Community Health, MSA Bulletin 10-30 (Lansing, MI: Michigan Department of Community Health, Medical Services Administration, Aug. 10, 2010): https://michigan.fhsc.com/Downloads/ MSA_10-30_330003_7.pdf (accessed 8/20/15).
8 State of Michigan, Healthy Michigan Plan, MI Health Account (Lansing, MI: Healthy Michigan Plan, 2015): http://www.michigan.gov/healthymiplan/0,5668,7-326-67957_69564—,00.html (accessed 8/20/15).
9 U nitedHealthcare, Healthy Michigan Plan – Health Risk Assessment
Provider FAQ’s (Southfield, MI: United Healthcare, April 2014): http://www.uhccommunityplan.com/content/dam/communityplan/healthcareprofessionals/providerinformation/MI-Provider-Information/MI_Healthy_Incentive_FAQ.pdf (accessed 8/20/15).
10 HealthPlus Partners Healthy Michigan, HealthPlus Partners will reward you for taking steps toward getting and staying healthy! (N.P.: HealthPlus, April 8, 2014): https://www.healthplus.org/uploadedFiles/PDFs/Healthy_Michigan/HMP%20HRA%20Member%20Incentives%20Letter%20050514.pdf (accessed 8/20/15).
11 U .S. Centers for Medicare & Medicaid Services, Preventive Health Services for Adults (Baltimore, MD: U.S. Centers for Medicare and Medicaid Services, N.D.): https://www.healthcare.gov/preventive-care-benefits/ (accessed 6/25/15).

A tale of three cities: Hospital and health system costs in the Midwest

A Midwestern city at night with buildings lit up.

There is tremendous variation in health care spending by geographic region in the United States. To better understand this variation, CHRT analyzed health care markets, state-level regulation, and hospital cost variation in three Midwestern states, focusing on the largest city in each state: Detroit, Michigan; Indianapolis, Indiana; and Milwaukee, Wisconsin. These states were chosen for their diverse health care policies and market conditions. This brief describes trends in state-level health spending and factors that may contribute to the differences in spending among the three states.

Key findings include:

  • From 2001 to 2009, Michigan had the lowest overall health care cost per capita among the three Midwestern states in this analysis, while Wisconsin had the highest. Michigan also had the lowest average annual growth in spending per capita from 1991 to 2009, and Wisconsin had the highest. Many complex factors contributed to these differences, and likely included market conditions and regulations that varied by state.
  • In fiscal year 2013, Michigan had the lowest and Wisconsin had the highest per capita hospital spending among the three states in this analysis.
  • Market conditions and policies affecting the size of hospitals’ profit margins varied by state. See our report for details for Indiana, Michigan, and Wisconsin.
  • In fiscal year 2013, health system operating cost and total profit margins varied greatly in the three cities of the Midwestern states in this analysis. See our report for details for Detroit, Indianapolis, and Milwaukee.

Suggested citation: Dreyer, Theresa; Koss, Joseph; and Udow-Phillips, Marianne. A Tale of Three Cities: Hospital and Health System Costs in the Midwest. April 2015. Center for Healthcare Research & Transformation. Ann Arbor, MI.

Special thanks to Dean G. Smith, PhD, for guidance on the financial analysis.

READ THE BRIEF

Cover Michigan Survey: Coverage and health care access trends in the wake of the ACA

A patient smiles at a doctor.

This brief provides evidence of a dramatic change in Michigan’s health care landscape as a result of the first year of the ACA’s coverage expansions. Overall, the number of residents reporting they were uninsured, struggled to pay medical bills and/or delayed seeking needed medical care has dropped significantly compared to CHRT survey findings before the launch of the ACA coverage expansions. While most insured Michiganders reported easy access to primary care, they did, however, report a greater challenge in obtaining access to specialty care in 2014 than they reported before the ACA coverage expansions.

The Michigan health insurance landscape changed substantially in the wake of the Affordable Care Act’s coverage expansion provisions. Starting in January 2014, many eligible individuals could enroll in private insurance coverage through the Health Insurance Marketplace and receive financial assistance to lower their cost of coverage. On April 1, 2014, Michigan residents below 138 percent of the federal poverty level who were not previously eligible for Medicaid became eligible for the Healthy Michigan Plan, Michigan’s expanded Medicaid program.

Using data from two of the Center for Healthcare Research & Transformation’s Cover Michigan Surveys, this brief explores consumer experiences with insurance coverage and access to care within the state of Michigan between mid-2012 and late 2014. The 2014 survey was fielded beginning in September 2014, five months after the first Marketplace enrollment period ended and Healthy Michigan Plan enrollment had begun. By the end of the Marketplace’s first open enrollment period in March 2014, 272,000 Michigan residents had selected coverage through the Marketplace. By September 2014, 410,000 people were enrolled in the Healthy Michigan Plan, bringing the state’s total Medicaid enrollment to 2.2 million by that time.

Key findings include:

  • More Michigan residents gained health care coverage—the proportion of adult Michiganders who reported being uninsured was cut in half, from 14 percent in 2012 to 7 percent in 2014 after the ACA.
  • Overall, from 2012 to 2014, those with insurance coverage reported access to primary care remained easy. Nearly 90 percent of insured adults reported having very or somewhat easy access to routine primary care appointments in 2012 and 2014.
  • Fewer people reported that they had delayed seeking medical care—22 percent of all respondents reported that they had not sought medical care they believed to be necessary in the previous six months in 2014, compared to 29 percent in 2012.
  • Between 2012 and 2014, Michiganders also reported fewer financial concerns associated with their health care:
    • In 2014, half as many respondents cited cost as a reason for not seeking needed medical care (21 percent, compared to 42 percent in 2012).
    • In 2014, 20 percent of respondents reported struggling to pay medical bills, compared to 27 percent in 2012.
  • Uninsured adults reported that it was more difficult to obtain primary care between 2012 and 2014. Those who reported very or somewhat easy access to primary care appointments declined from 67 percent in 2012 to 48 percent in 2014.
  • More people reported difficulty obtaining access to specialty care in 2014 compared to 2012. Specifically, 34 percent of adult Michiganders reported it was “very easy” to get an appointment with a specialist in 2012, compared to 24 percent in 2014.

Suggested Citation: Smiley, Mary L.; Riba, Melissa; Ndukwe, Ezinne G.; Udow-Phillips, Marianne. Cover Michigan Survey: Coverage and Health Care Access. (Ann Arbor, MI: Center for Healthcare Research and Transformation, March 2015).

Acknowledgements: The staff at the Center for Healthcare Research & Transformation would like to thank Thomas Buchmueller, Matthew M. Davis, Robert Goodman, Helen Levy, Renuka Tipirneni, and the staff of the Institute for Public Policy and Social Research (IPPSR) at Michigan State University for their assistance with the design and analysis of the survey.

READ THE BRIEF