Publications

Insurance Churning

White and blue churning waterThe uninsured rate has declined substantially since provisions of the Patient Protection and Affordable Care Act (ACA) came into effect. Nevertheless, many individuals continue to experience instability in insurance coverage. Transitions between different insurance plans, as well as between insured and uninsured status, are often referred to as “insurance churning.”

The causes of insurance churning vary. Changes in job status may result in loss of coverage or transition to a new insurance plan. Eligibility for Medicaid or plans with Marketplace subsidies may change based on changes in family composition or fluctuations in income. Nationally, three to five percent of members are dropped each month by health plans offered on the Health Insurance Exchange due to non-payment of premiums.

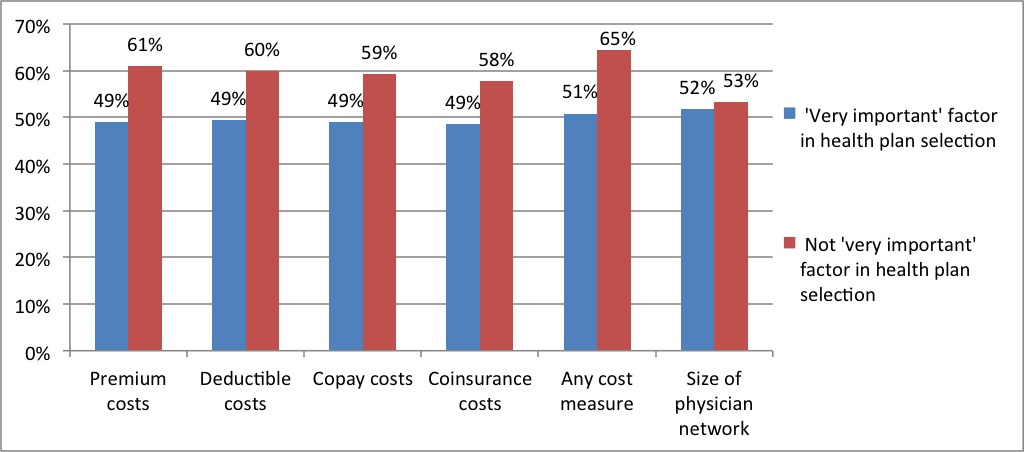
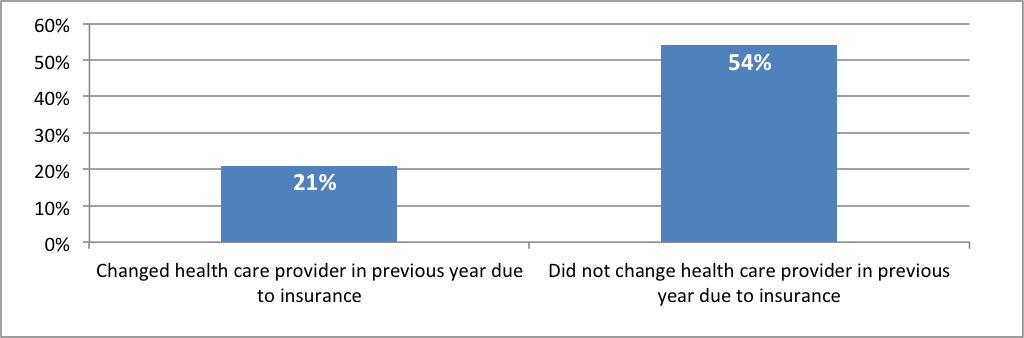
Insurance churning can affect quality, cost, and continuity of care. Individuals may avoid seeking health care when they need it during gaps in insurance coverage. Even if consumers maintain continuous coverage while transitioning between different insurance plans, they may find that their regular health care providers do not accept their new insurance plan. In addition, when they change health plans, research shows that medication compliance is often disrupted. These and other churning-related problems tend to be exacerbated by uncertainty about what new co-pays or deductibles might be as well as by known increased costs associated with new insurance plans.

A recent study found no evidence of significant increases or decreases in broader indicators of insurance churning since the introduction of the ACA in three states (Texas, Kentucky, and Arkansas). Under the new administration, depending on which provisions of the ACA are repealed, replaced, defunded, or retained in the coming years and how these changes are implemented, rates of insurance churning could change dramatically.

Between 2013 and 2015, data from the Census Bureau show that the proportion of Michiganders who reported no source of health insurance declined by five percentage points—from 11 percent to 6 percent. Using data from the Center for Health and Research Transformation’s Cover Michigan Survey, this brief explores consumer experiences with insurance churning and access to care within the state of Michigan for approximately a one-year period in 2014–2015.

Key findings include:

  • Medicaid recipients had the most instability in their coverage status of all respondents to the survey. Medicaid recipients were also seven times more likely to have experienced a temporary uninsured period in the past year compared to respondents with employer-sponsored or individual coverage.
  • Those with individually purchased coverage in 2014 were the most likely to switch to a different type of coverage in 2015. Among respondents with an individually purchased plan in 2014, less than half reenrolled in the same plan in 2015, and nearly a third transitioned to Medicare or to an employer-sponsored plan in 2015.
  • Those with employer-sponsored coverage experienced the least amount of churning compared to respondents with other coverage. Ninety-four percent of respondents with employer-sponsored coverage remained continuously insured from 2014 to 2015.

READ THE REPORT

Publicly Reported Hospital Quality Rankings

Five wooden stars arranged on wooden blocks.Publicly-reported hospital rankings are released annually and are widely publicized by both the sponsors of the rankings and hospitals that are highly ranked as indicators of hospital quality or safety. Meant to be a useful way for consumers to assess hospital quality, these ranking systems produce inconsistent, contradictory, and confusing results, as some hospitals are highly ranked in some systems but not in others.

The use of a unique set of criteria by each ranking system contributes to these inconsistent results. For example, a 2015 Health Affairs study compared hospital rankings from four prominent ranking systems and found that no hospital was ranked as a “top performer” by all four systems and only 10 percent were ranked highly by more than one ranking system, suggesting a lack of agreement regarding what constitutes high-quality hospital performance.

Federal ranking systems are no exception. For example, the Centers for Medicare & Medicaid Services (CMS) star ranking system was recently criticized for purportedly giving a disproportionate amount of low rankings to teaching hospitals and hospitals that serve low-income populations.

Moreover, there is some evidence that consumers do not utilize hospital rankings to make healthcare decisions, calling into question the value of these rankings from a consumer perspective.

This brief builds on previous findings by examining hospital rankings in Michigan and nationwide from nine well-known hospital ranking systems. This brief also examines the measures and methods used to assess hospital quality, and the extent to which hospital rankings address consumer needs regarding hospital choice. It includes summarized information from a 2014 systematic review of hospital quality rankings, an analysis of 2015 Michigan hospital rankings, and results from three consumer focus groups that were convened in 2016 to understand how consumers interpret and understand these rankings (see Methodology for more information regarding the analyses and focus groups).

Key findings include:

  • In 2012, more than one-third (37 percent) of U.S. hospitals were highly ranked(1)Hospitals were counted as “highly ranked” according to the methodology used by each individual ranking system. Because Leapfrog Safety Grade assigns a grade (“A” through “F”) to all hospitals, we counted hospitals that received an “A” as “highly ranked.” on one of nine hospital ranking systems;
  • In 2015, over half of Michigan acute care hospitals (52.7 percent) received a high rank on at least one of nine hospital ranking systems but less than one-fourth (22.5 percent) received a high rank on at least two ranking systems;
  • Each ranking system’s unique approach to evaluating hospital performance, including different goals, measures, and data sources, contributes to inconsistent results; and
  • Consumers report that they are not using rankings to choose a hospital because the rankings do not always include information that consumers are interested in and are not presented in a consumer-friendly manner.

Editor’s Note: This brief was based on a CHRT-funded unpublished manuscript by Kim, BoRin; Hu, Hsou-Mei; Bahl, Vinita: An Analysis of Publicly Reported Hospital Rankings of Hospital Quality.

READ THE REPORT

References

References
1 Hospitals were counted as “highly ranked” according to the methodology used by each individual ranking system. Because Leapfrog Safety Grade assigns a grade (“A” through “F”) to all hospitals, we counted hospitals that received an “A” as “highly ranked.”

Effects of the Affordable Care Act on the Health Care Safety Net in Detroit

A map of DetroitSince its passage in 2010, the Affordable Care Act (ACA) has introduced a series of health care financing and delivery reforms to expand coverage, invest in health care infrastructure, and implement changes to improve quality and costs. In 2014, the ACA’s coverage expansion began in Michigan through the launches of the health insurance marketplaces on January 1 and the Healthy Michigan Plan (Michigan’s Medicaid expansion program) on April 1. These programs have contributed to sharp reductions in the number of uninsured Michigan residents.

The ACA coverage expansion has also had outsized effects on the health care safety net, particularly for federally qualified health centers (FQHCs). These centers are supported through federal grants to deliver services in impoverished and high-need areas, and have traditionally been a major source of medical services for the uninsured. FQHCs have been expected to financially benefit under the ACA from serving more patients with health insurance. In addition, the ACA supported grants to local organizations to bolster the safety net, the health care workforce, public health infrastructure, and other quality improvement programs. This brief will describe the effects of the ACA on the safety net in Detroit, with a focus on the experiences of the city’s FQHC providers.

Key findings include:

  • Detroit-based organizations have received more than $100 million in federal grant funding supported by the ACA and subsequent legislation to expand delivery capacity, train new health care workers, and develop other programs.
  • The number of patients and patient visits at FQHCs in Detroit increased by over 6% from 2013 to 2014, and the number of uninsured patients decreased by over 30% as the ACA’s coverage expansion took effect.
  • Detroit FQHC patients tend to be poorer and are more likely to be racial minorities than other FQHC patients in Michigan. The characteristics of FQHC patients in Detroit were relatively stable from 2013 to 2014.
  • The number of health care providers (physicians, nurses, physician assistants, etc.) employed directly by FQHCs grew by over 21% from 2013 to 2014 as FQHCs prepared to serve more patients. As FQHCs adjust to the new environment under the ACA, many are working to develop new strategies to serve unmet patient needs, particularly in areas related to behavioral health, oral health, substance use, and transportation.

These CHRT reports were produced for the Altarum Institute’s Center for Sustainable Health Spending, which received funding from the National Institute for Health Care Reform to examine strategies for improving the health of the people of Detroit, and the related economic consequences.

READ THE REPORT

Effects of the Affordable Care Act on Health Insurance Coverage in Southeast Michigan

Map of Michigan in green.Combined with a decreasing unemployment rate, the Affordable Care Act’s (ACA) coverage expansion contributed to a sharp decrease in Michigan’s uninsured rate in 2014. However, effects of the coverage expansion have been uneven, and socioeconomic and geographic disparities in coverage remain across the state.

Since the launch of the ACA coverage expansion in 2014, millions of previously uninsured Americans have enrolled in health insurance. The ACA coverage expansion has two primary components: expansion of Medicaid eligibility to low-income adults and financial assistance to help individuals purchase private coverage through the health insurance marketplaces. Expanded health insurance coverage under the ACA has coincided with improved access to medical care and reductions in problems paying medical bills for many families. In addition, providers have seen a reduction in uncompensated care costs since the ACA coverage expansion began.

This brief describes the ACA coverage expansion for southeast Michigan (Livingston, Macomb, Monroe, Oakland, Washtenaw, and Wayne counties) and the reductions in the uninsured population. It also examines the remaining uninsured population and the potential for further gains in health insurance coverage.

Key findings include:

  • The number of residents in southeast Michigan who selected a marketplace plan during open enrollment increased from about 141,000 in 2014 to 164,000 in 2015. However, the number of plan selectors was virtually unchanged in Wayne County.
  • Total Medicaid enrollment, including both traditional Medicaid and Healthy Michigan Plan (Michigan’s Medicaid expansion program) enrollment, grew in each county in southeast Michigan, increasing from about 877,000 prior to launch of the Healthy Michigan Plan in April 2014 to 1.12 million in August 2015. In Wayne County, more than 36% of residents were enrolled in Medicaid by December 2015.
  • Every county in southeast Michigan experienced a decrease in the number of uninsured residents from 2013 to 2014, with Wayne County experiencing the sharpest decrease, from 16.4 to 12.5%.
  • Within the City of Detroit, the uninsured rate fell from 22.5 to 17.1% in 2014 as both public and private coverage increased.
  • Areas within the City of Detroit experienced the largest coverage gains in the region in 2014, but the magnitude of coverage gains varied across the region.
  • Across southeast Michigan in 2014, more than three out of four uninsured residents were eligible
    for financial assistance under the ACA, either through Medicaid, the Children’s Health Insurance
    Program (CHIP), or subsidies through the health insurance marketplace.

This CHRT report was produced for the Altarum Institute’s Center for Sustainable Health Spending, which received funding from the National Institute for Health Care Reform to examine strategies for improving the health of the people of Detroit, and the related economic consequences.

READ THE REPORT

Changes in Health Insurance Coverage in the United States, 2014

A red umbrella opened above many open black umbrellas, symbolizing new health insurance coverage.These figures describe the health insurance coverage changes that occurred during the 2014 calendar year, the first year of the Affordable Care Act’s (ACA) coverage expansion provisions. These provisions included the launch of the health insurance marketplaces in all states and the optional Medicaid expansion adopted by 26 states and the District of Columbia in 2014.

Overall, the number of uninsured Americans declined considerably over the course of 2014. However, many Americans continued to experience short spells of uninsurance or other changes in their coverage situation over the course of the year. Compared to Medicaid and individual market coverage, employer-sponsored insurance continued to be the most stable form of coverage in 2014.

To determine the changes in health insurance coverage in the first year of the ACA, CHRT analyzed data from the household component of the Medical Expenditure Panel Survey (MEPS). MEPS is a federal survey that measures the cost and use of health care and asks respondents to identify the type(s) of health insurance coverage they had each month, if any.

Figures in this infographic include:

  • Number of non-elderly Americans by coverage category from January to December 2014
  • Percentage of non-elderly Americans by number of uninsured months during year
  • Percentage of non-elderly Americans who started with an maintained the same coverage all year
  • Number of uninsured non-elderly Americans by month in 2014

CHRT has also published a brief examining the effects of the ACA on health insurance coverage in Southeast Michigan.

READ THE INFOGRAPHIC

Cover Michigan Survey: The Uninsured in Michigan

Medical symbols in blue with "Affordable Care Act" written in the center.

This brief examines the characteristics of those in Michigan who reported being uninsured, approximately two years after the ACA’s major coverage provisions went into effect beginning in 2014.

A major goal of the Affordable Care Act was to reduce the number of Americans who are uninsured. The main provisions of the law that were intended to help achieve that reduction include: 1) the individual mandate, 2) the expansion of Medicaid, 3) the creation of the health insurance marketplaces and the introduction of subsidies for individuals purchasing coverage, 4) the extension of coverage to adult children up to age 26, and 5) requirements that certain employers offer affordable health insurance coverage or pay a penalty.

Requirements that insurers cover those with preexisting conditions and prohibitions on rescission of coverage were also intended to further expand the number of Americans with access to affordable coverage. Because of these policies, estimates show that 16 million Americans gained insurance between 2010 and 2015. Nevertheless, an estimated 29 million Americans remained uninsured in 2015.

Our study of the uninsured in Michigan in 2014 and 2015 is based on data from the Center for Healthcare Research & Transformation’s (CHRT) 2015 Cover Michigan Survey of Michigan adults, fielded between October and December 2015. Comparison data is drawn from the 2009, 2011, 2012, and 2014 Cover Michigan Surveys.

Key findings include:

Since 2009, Michigan’s uninsured rate has declined dramatically. Specifically:

  • 5 percent of respondents reported being uninsured at the time of the survey. By comparison, in 2012, 14 percent of respondents reported being uninsured.
  • More than twice as many respondents reported having been uninsured at some point during the year before the survey than were uninsured at the time of the survey, indicating that many of the uninsured gained or regained coverage relatively quickly.
  • 41 percent of the uninsured reported annual household incomes below $30,000, and 54 percent reported incomes between $30,000 and $59,999.
  • Half of uninsured respondents worked full time.
  • 64 percent of the uninsured were male.
  • 39 percent of uninsured respondents were between the ages of 18 and 30.
  • Half of uninsured respondents lived in small cities or towns.

READ THE REPORT

Hospital Uncompensated Care, 2014

A drawing of a hospital.2014 marked the launch of the health insurance marketplaces and Medicaid expansion under the Affordable Care Act (ACA). These programs expanded health insurance coverage to many previously uninsured residents, resulting in sharp decreases in the uninsured rate both nationwide and in Michigan. Expanded access to health insurance can benefit health care providers, such as hospitals, financially through reducing their uncompensated care burden.

Hospitals have traditionally provided care for free and/or at reduced prices to indigent and uninsured patients as part of their own social mission and to meet regulatory requirements. For example, non-profit hospitals are required to participate in community benefit activities, such as providing charity care, in order to maintain their tax-exempt status, a financial benefit for hospitals. Tax exempt status for hospitals nationwide was valued at over $24 billion in 2011.

Charity care is delivered without the expectation of receiving payment, and bad debt occurs when a hospital bills for but is unable to collect the entire amount due from a patient. In order to see if hospitals have benefited from the ACA coverage expansion, particularly the optional Medicaid expansion, CHRT examined uncompensated care trends and other indicators for hospitals in Michigan and other states.

Key findings include:

  • Uncompensated care costs for Michigan hospitals decreased by almost 23 percent from 2013 to 2014, with most of the decrease occurring for charity care.
  • Hospitals in Medicaid expansion states experienced much sharper decreases in uncompensated care costs from 2013 to 2014 (27 percent) compared to those in non-expansion states (3 percent).
  • In Michigan, uncompensated care’s share of operating expenses fell in 2014, and operating margins also improved from 2013 levels. However, operating margins varied by location.
  • The number of Medicaid inpatient days and outpatient visits at Michigan hospitals increased by almost 8 percent in 2014, while other patient volume fell by almost 3 percent. Overall, patient volume was relatively stable from 2013 to 2014.

READ THE REPORT

The uninsured in Michigan: Who benefited most from the ACA?

A road map of Michigan.In 2014, millions of previously uninsured Americans gained health insurance coverage through the Affordable Care Act’s (ACA) Medicaid expansion and financial assistance available through the health insurance marketplace. These programs, combined with Michigan’s unemployment rate dipping to its lowest level since 2007, contributed to Michigan’s significant decrease in the number of uninsured residents in 2014. This brief identifies which groups experienced the largest changes in health insurance coverage in Michigan in 2014. It also analyzes the ACA’s individual mandate and the possible penalty amounts Michigan’s remaining uninsured may face.

Key findings include:

  • The share of Michigan residents without health insurance dropped from
    11 percent in 2013 to 8.5 percent in 2014 as the ACA’s coverage expansion
    provisions took effect.
  • All age groups experienced declines in the number of uninsured, but the
    declines were most prominent for young adults under age 35.
  • Uninsured rates fell for many subpopulations in 2014, yet sharp disparities
    remain by race, ethnicity, and income. Hispanic individuals remain more than
    twice as likely to be uninsured as white individuals.
  • Certain geographic regions in Michigan experienced large coverage gains in
    2014, yet many rural areas and areas within Detroit continue to have high rates
    of uninsured.
  • The individual mandate penalty is likely to affect as much as 60 percent of the
    uninsured in Michigan, and the average annual penalty amounts are estimated
    to increase from $126 in 2014 to $446 in 2016.

For information on the characteristics of those in Michigan who reported being uninsured, read our follow up brief.

READ THE REPORT

The Affordable Care Act and its effect on employers: Trend analysis

A doctor's hands on a keyboard in the background with a stethoscope and clipboard in the foreground.The Patient Protection and Affordable Care Act of 2010 (ACA) contains several provisions that directly affect employers and impact the employer-sponsored health insurance (ESI) system through which the majority of Americans receive coverage. While some experts predicted declines of 4.5 percent or more in employer-sponsored coverage from 2010 to 2016, ESI remained stable in Michigan in 2014, with the continuation of many notable trends.

This brief updates one published earlier in 2015 by summarizing trends in employer coverage in 2014, when many ACA provisions took effect. This brief also summarizes recent legislative and regulatory changes to provisions of the ACA relevant to employers, as well as an update on certain key provisions that have faced implementation challenges.

Key findings include:

  • Similar to prior years, more than three out of four business establishments in Michigan had fewer than 50 workers in their firm in 2014. However, the share of these firms that offered health insurance to their workers declined from 40 percent in 2013 to 33 percent in 2014. In contrast, over 90 percent of larger firms offered coverage.
  • From 2009 to 2014, average premiums grew faster for larger employers than for small employers, while overall premium growth remained below the national average. On the other hand, average deductibles grew faster from 2013 to 2014 than the national average. However, average deductible levels remain below the national average.
  • The enrollment rate of eligible workers in their employer’s health plan increased both in Michigan and nationwide in 2014. However, the rate of self-insurance among small groups in Michigan decreased in 2014.
  • Multiple ACA provisions for employers were substantially changed in 2015, as Congress passed separate legislation pausing three ACA taxes, repealing the automatic enrollment requirement, and making the small group definition a state option for 2016. The employer mandate was implemented for firms with 100 or more full-time equivalent (FTE) workers in 2015, and will be fully implemented for firms with 50 or more FTE workers in 2016.

READ THE BRIEF

Cover Michigan 2014 Survey: Satisfaction with Health Coverage in Michigan

Michigan doctor selecting a rating out of five stars as on a survey.The third open enrollment period for individual coverage on Michigan’s health insurance marketplace began on November 1, 2015, and will continue until January 31, 2016.(1)U.S. Centers for Medicare & Medicaid Services. November 2015. 2016 health insurance dates and deadlines.https://www.healthcare.gov/quick-guide/dates-and-deadlines/ (accessed 11/4/15) The average Michigan consumer will have 64 plans to choose from during the 2015 open enrollment period.(2)J. Fangmeier, 2015 Marketplace Rate Analysis (Ann Arbor, MI: Center for Healthcare Research & Transformation, Nov. 2015). Nationwide, 31 percent of consumers with marketplace coverage in both 2014 and 2015 switched plans during last year’s open enrollment period(3) T. DeLeire and C. Marks. Department of Health & Human Services. October 2015. Consumer Decisions Regarding Health Plan Choices in the 2014 and 2015 Marketplaces. http://aspe.hhs.gov/sites/default/files/pdf/134556/Consumer_decisions_10282015.pdf (accessed 11/4/15).

This brief examines how factors influencing health plan selection, both on and off the marketplace, were related to consumer satisfaction with insurance coverage. Our analyses suggest that when selecting a health plan during open enrollment, consumers may be happier with their coverage if they ensure that their plan includes their current primary care provider rather than looking for the plan with the widest network. Comparison shopping among plans at similar price points and looking for value instead of price alone may also lead to increased health plan satisfaction.

The brief is based on data from the Center for Healthcare Research & Transformation’s 2014 Cover Michigan Survey of Michigan adults, fielded between September and November 2014. Detailed methodology is available at https://chrt.org/publication/health-plan-selection-factors-influencing-michiganders-choice-of-health-insurance/.

Key findings include:

  • Consumers for whom price played a major role when selecting a health plan were less likely to be satisfied with their plans than those for whom price was a less important consideration.
  • Consumers whose insurance did not include their primary care provider were far less likely to be satisfied with their coverage than those whose providers were included in their plans.

Findings from the 2014 Cover Michigan Survey

Forty-nine percent of respondents who reported that premium costs were a very important consideration when selecting a health insurance plan were satisfied with their plan (defined as having rated it as ‘excellent’ or ‘very good’), compared to 61 percent of respondents for whom premium costs were not such an important consideration. Similar differences existed for those who reported that deductible, copay, and coinsurance costs had been very important considerations in their selection of a plan, but respondents for whom the number of physicians in the plan had been a very important consideration were equally likely to report being satisfied with their coverage as those for whom this had not been as important factor FIGURE 1.

Figure 1: Percent of respondents satisfied with coverage, by importance of cost and network size in plan selection

Figure1

Source: CHRT Cover Michigan Survey 2014.

Only 21 percent of respondents who reported having had to change health care providers in the previous year because their provider was not included in their plan were satisfied with their coverage, compared to 54 percent of respondents whose insurance did not cause them to switch providers FIGURE 2.

Figure 2: Satisfaction with coverage, by insurance inclusion of provider
Figure2

Source: CHRT Cover Michigan Survey 2014.

READ THE BRIEF

References

References
1 U.S. Centers for Medicare & Medicaid Services. November 2015. 2016 health insurance dates and deadlines.https://www.healthcare.gov/quick-guide/dates-and-deadlines/ (accessed 11/4/15)
2 J. Fangmeier, 2015 Marketplace Rate Analysis (Ann Arbor, MI: Center for Healthcare Research & Transformation, Nov. 2015).
3 T. DeLeire and C. Marks. Department of Health & Human Services. October 2015. Consumer Decisions Regarding Health Plan Choices in the 2014 and 2015 Marketplaces. http://aspe.hhs.gov/sites/default/files/pdf/134556/Consumer_decisions_10282015.pdf (accessed 11/4/15).