Decrease in Hospital Uncompensated Care in Michigan, 2015
The Affordable Care Act (ACA) expanded access to health insurance coverage for Michigan residents in 2014 through the creation of the Health Insurance Marketplace and the expansion of the Medicaid program. Since then, Michigan has experienced large decreases in the number of adults who lack health insurance, delay necessary care, and have trouble paying their medical bills.(1)E. Austic, E. Lawton, M. Slowey, M. Riba, and M. Udow-Phillips, Changes in Health Care Cost Barriers under the Affordable Care Act in Michigan (Ann Arbor, MI: Center for Healthcare Research and Transformation, 2017). Hospitals also appear to have reaped the benefits of the ACA’s coverage expansions. Following the expansion of Michigan’s Medicaid program in April 2014, Michigan hospitals experienced a steep drop in uncompensated care costs. In 2015, uncompensated care costs continued to decline, and as uncompensated care’s share of hospital operating expenses decreased, the median hospital operating margin in Michigan improved for the second year in a row. As policymakers debate changes to the Affordable Care Act and Medicaid, it is important to assess the financial gains that Michigan hospitals have received in the first two years of ACA implementation and the potential losses they could incur with a repeal of the ACA.
For an analysis of uncompensated care costs nationwide and a comparison of these trends in several Midwestern states, please see CHRT’s companion piece, Hospital Uncompensated Care in the United States, 2015 – Comparison of Midwest States.
Hospital Uncompensated Care and Financial Trends
Recent studies have documented decreases in uncompensated care and the proportion of uninsured patients in Michigan hospitals after the ACA’s coverage expansion began in 2014. One study used Medicaid cost reports to find that uncompensated care costs for 88 Michigan hospitals(2)88 hospitals in the state of Michigan reported FY2015 data at the time of the study. decreased from $627 million in 2013 to $332.1 million in 2015.(3)T. Buchmueller, H. Levy, S. Nikpay, and J. Rhodes, Healthy Michigan Plan 2015 Report on Uncompensated Care and Insurance Rates, prepared for the Michigan Department of Health and Human Services, December 31, 2016 (accessed 6/12/17).
Another study examined shifts in payer mix in Michigan hospitals following the launch of the Healthy Michigan Plan in April 2014. This study found that the proportion of uninsured patients in Michigan hospitals from April-December 2014 decreased by four percentage points and the proportion of patients with Medicaid coverage increased by 6.5 percentage points compared to the same time periods in 2012 and 2013.(4)M. Davis, A. Gebremariam, and J. Ayanian, “Changes in Insurance Coverage Among Hospitalizeds Nonelderly Adults After Medicaid Expansion in Michigan,” Journal of the American Medical Association, June 21, 2016 (accessed 6/12/17).
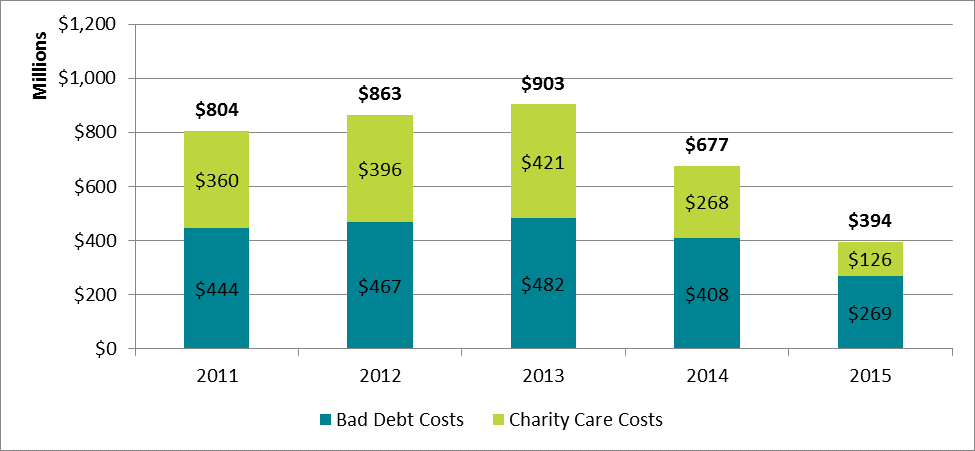
In the present study, CHRT used Medicare cost reports to examine the financial characteristics of 104 hospitals in Michigan. Michigan expanded Medicaid eligibility with the launch of the Healthy Michigan Plan on April 1, 2014. By the end of the year Michigan experienced a sharp decline in uncompensated care, dropping from $903 million in 2013 to $677 million in 2014 (see Figure 1). This drop continued into 2015 as uncompensated care fell to $394 million, a decrease of 56 percent from 2013 levels.
Uncompensated care comprises both charity care costs and bad debt costs. The effect of the Medicaid expansion was larger for the charity care portion of uncompensated care compared to the bad debt portion. Charity care expenses for hospitals decreased by 70 percent from 2013 to 2015.
Figure 1: Hospital Uncompensated Care Costs in Michigan, by Bad Debt and Charity Care, 2011–2015

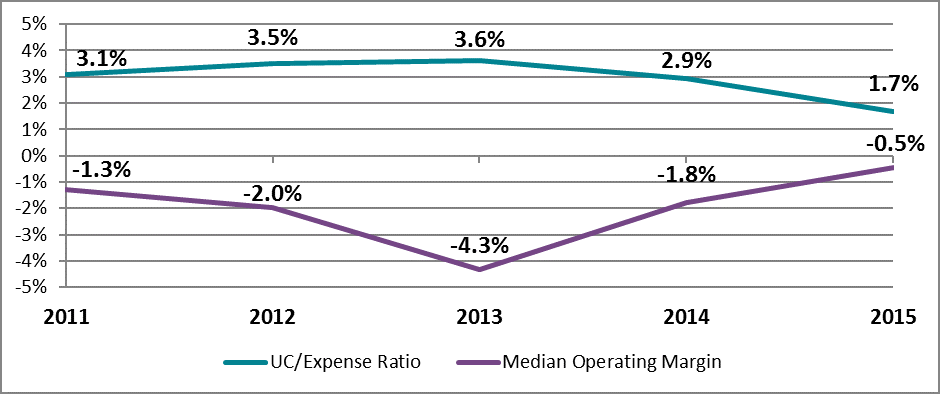
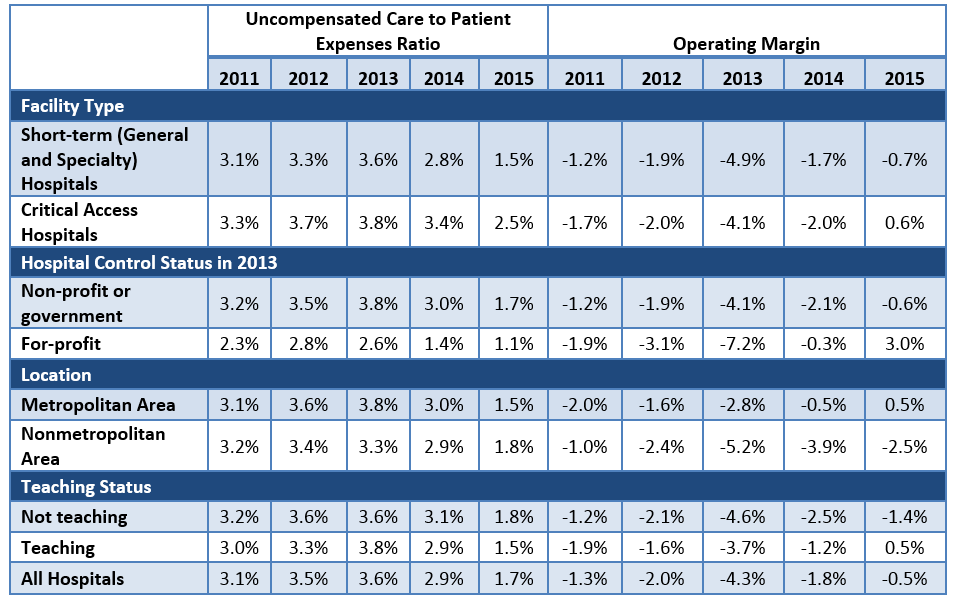
From 2013 to 2015, Michigan hospitals generally experienced improved overall financial outcomes as well as decreased uncompensated care burdens. Uncompensated care’s share of hospital expenses fell from 3.6 percent for the median hospital in 2013 to 1.7 percent in 2015 after increasing in the years prior to Medicaid expansion (see Figure 2). However, hospitals had different levels of uncompensated care burdens and the effects of coverage expansion varied by specific hospital characteristics (see Appendix).
Coinciding with the decline in uncompensated care costs, the median hospital operating margin (net profits from patient care services) increased from -4.3 percent in 2013 to -0.5 percent in 2015. The ACA includes several quality improvement programs, such as penalties for hospital readmissions, which affect Medicare reimbursement. While these types of penalties may have had a negative effect on the profitability of certain hospitals, many hospitals experienced substantial gains in profitability in 2015.
Figure 2: Median Hospital Financial Indicators in Michigan, 2011–2015

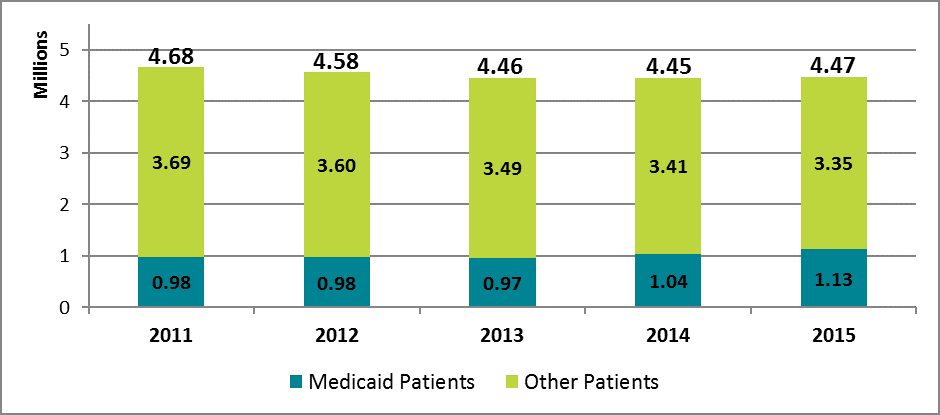
From 2011 to 2013 the number of inpatient days and outpatient visits at Michigan hospitals decreased from 4.68 million to 4.46 million (see Figure 3). In 2015, Medicaid volume increased by 16 percent to 1.13 million inpatient days and outpatient visits, while volume for other payers decreased by 4 percent. Overall volume has remained nearly unchanged from 2013 to 2015. Medicaid’s share of total patient volume increased from 21.7 percent in 2013 to 25.2 percent in 2015.
Figure 3: Hospital Inpatient Days and Outpatient Visits for Michigan Hospitals by Payer, 2011–2015

Conclusion
Hospital financial performance in Michigan has improved in the two years since the implementation of the ACA’s coverage expansions in 2014. Michigan continued to experience a decline in hospital uncompensated care costs in 2015 as hospitals saw fewer uninsured patients and a higher proportion of patients covered by Medicaid. Overall hospital operating margins also improved in 2015. Medicaid expansion appears to have had a positive effect on hospitals’ uncompensated care costs and overall margins since the launch of the Healthy Michigan Plan in 2014. With policymakers currently debating changes to Medicaid and the future of the Affordable Care Act, it will be important to monitor the connection between the coverage expansions created under the law and the financial performance of health care providers. Policy changes that reverse the ACA’s coverage gains could also affect hospitals’ financial status.
Data and Methodology
We extracted hospital data on uncompensated care and other facility characteristics from publicly available cost reports submitted by hospitals to the Centers for Medicare and Medicaid Services (CMS) via the Healthcare Cost Report Information System (HCRIS). Data include reports collected by December 31, 2016, which were released on January 19, 2017. For this analysis, we restricted the set of hospitals to short-term acute and critical access hospitals that submitted complete reports for each year from 2011 through 2015. This eliminated rehabilitation, long-term, psychiatric, children’s, and other specialty hospitals that have high nonresponse rates or are not largely affected the ACA’s Medicaid expansion. The resulting data set includes 3,474 hospitals nationwide and 104 in Michigan.
Hospitals submit worksheet S-10 as part of their cost report that breaks down their uncompensated care costs into their separate sources. In our analysis, we define uncompensated care as the sum of charity care (care delivered with no expectation of payment) and bad debt (care that is billed but no payment is received), but underpayments from public payers (Medicare, Medicaid, and the Children’s Health Insurance Program) were excluded. The use of cost report data for uncompensated care research is still relatively new, and not all responses from hospitals are audited by CMS. However, MedPAC has supported using worksheet S-10 to directly measure uncompensated care costs.(5)Medicare Payment Advisory Commission. Report to the Congress: Medicare Payment Policy. March 2016. http://www.medpac.gov/docs/default-source/reports/march-2016-report-to-the-congress-medicare-payment-policy.pdf (accessed 3/17/16). Data for inpatient days and outpatient visits were extracted from worksheet S-3, part 1, and data on operating margins were extracted from worksheet G-3 of the cost reports.
Cost reports submitted to hospitals are based on individual hospitals’ fiscal years, which have varying beginning and end dates. To generate comparable time-series measures, we converted hospital fiscal year measures to calendar year estimates by combining the portion of each fiscal year that fell within a given calendar year. Uncompensated care amounts were converted from charges to costs using hospital-specific cost-to-charge ratios calculated in the cost reports, and all financial measures were adjusted for inflation to 2015 dollars. Facilities that reported outlier uncompensated care amounts compared to their historic trend were dropped from the study.
Hospitals were identified as for-profit, nonprofit, or government-owned based on control status data from the 2013 American Hospital Association annual survey.(6)American Hospital Association. Annual Survey Database: http://www.aha.org/research/rc/stat-studies/data-and-directories.shtml (accessed 3/17/16). Metropolitan status was determined based on the U.S. Department of Agriculture’s rural-urban continuum codes for 2013,(7)US Department of Agriculture, Economic Research Service, Rural-Urban Continuum Codes: http://www.ers.usda.gov/data-products/rural-urban-continuum-codes.aspx (accessed 3/17/16). and hospitals were identified as teaching institutions if they indicated in their cost reports that they train residents as part of an approved graduate medical education program.
Appendix
Figure A-1: Median Financial Indicators for Michigan Hospitals by Select Characteristics, 2011–2015

References
| ↑1 | E. Austic, E. Lawton, M. Slowey, M. Riba, and M. Udow-Phillips, Changes in Health Care Cost Barriers under the Affordable Care Act in Michigan (Ann Arbor, MI: Center for Healthcare Research and Transformation, 2017). |
|---|---|
| ↑2 | 88 hospitals in the state of Michigan reported FY2015 data at the time of the study. |
| ↑3 | T. Buchmueller, H. Levy, S. Nikpay, and J. Rhodes, Healthy Michigan Plan 2015 Report on Uncompensated Care and Insurance Rates, prepared for the Michigan Department of Health and Human Services, December 31, 2016 (accessed 6/12/17). |
| ↑4 | M. Davis, A. Gebremariam, and J. Ayanian, “Changes in Insurance Coverage Among Hospitalizeds Nonelderly Adults After Medicaid Expansion in Michigan,” Journal of the American Medical Association, June 21, 2016 (accessed 6/12/17). |
| ↑5 | Medicare Payment Advisory Commission. Report to the Congress: Medicare Payment Policy. March 2016. http://www.medpac.gov/docs/default-source/reports/march-2016-report-to-the-congress-medicare-payment-policy.pdf (accessed 3/17/16). |
| ↑6 | American Hospital Association. Annual Survey Database: http://www.aha.org/research/rc/stat-studies/data-and-directories.shtml (accessed 3/17/16). |
| ↑7 | US Department of Agriculture, Economic Research Service, Rural-Urban Continuum Codes: http://www.ers.usda.gov/data-products/rural-urban-continuum-codes.aspx (accessed 3/17/16). |