Flu Vaccination in Michigan: Opportunities for Improvement
 Introduction
Approximately 6,000 Americans die of influenza every year,(1)Centers for Disease Control and Prevention, “Estimates of Deaths Associated with Seasonal Influenza — United States, 1976–2007,” Morbidity and Mortality Weekly Report (MMWR), Aug. 27, 2010, 59(33): 1057–62: http://www.cdc.gov/mmwr/preview/mmwrhtml/mm5933a1.htm (accessed 6/25/15) and almost 800 people were hospitalized during the 2014–2015 flu season in the four Michigan counties that report flu hospitalizations (Clinton, Eaton, Genesee, and Ingham counties).(2)Michigan Department of Health & Human Services, “Influenza Surveillance Report for the Week Ending June 13, 2015,” MI Flu Focus, Influenza Surveillance Updates, (Lansing, MI: Michigan Department of Health & Human Services, Bureaus of Epidemiology and Laboratories, June 24, 2015), 12(23): http://www.michigan.gov/documents/mdch/MIFF_6-24-15_492747_7.pdf (accessed 6/25/15). Although the Centers for Disease Control and Prevention (CDC) Advisory Committee on Immunization Practices recommends that all adults and children over the age of six months receive an annual flu vaccination,(3)Centers for Disease Control and Prevention, Advisory Committee on Immunization Practices (ACIP) Reaffirms Recommendation for Annual Influenza Vaccination (Atlanta, GA: CDC, Feb. 26, 2015): http://www.cdc.gov/media/releases/2015/s0226-acip.html (accessed 6/25/15). only 42 percent of American adults were vaccinated against the flu during the 2013–2014 flu season.(4)Centers for Disease Control and Prevention, Flu Vaccination Coverage, United States, 2013–14 Influenza Season (Atlanta, GA: CDC, September 14, 2014): http://www.cdc.gov/flu/fluvaxview/coverage-1314estimates.htm (accessed 9/1/15). Michigan’s vaccination rate during the 2013–2014 flu season was slightly lower than the national average at 40 percent.(5)Centers for Disease Control and Prevention, 2013–14 State, Regional, and National Vaccination Report II (Atlanta, GA: CDC, N.D.): http://www.cdc.gov/flu/fluvaxview/reportshtml/reporti1314/reportii/index.html (accessed 9/1/15). Effectiveness of the flu vaccine varies greatly from year to year based on the annual vaccine’s match with strains of flu virus circulating at the time as well as other factors. Nevertheless, even the 2014–2015 vaccine, which was not as well matched to the predominant strains during that season as some previous vaccines, was able to reduce the odds of influenza infection by almost one-fourth among those vaccinated in the United States.(6)Centers for Disease Control and Prevention, “Early Estimates of Seasonal Influenza Vaccination Effectiveness—United States, January 2015,” Morbidity and Mortality Weekly Report (MMWR), Jan. 16, 2015, 64(01): 10–15: http://www.cdc.gov/mmwr/preview/mmwrhtml/mm6401a4.htm (accessed 6/25/15).
Michiganders insured through Medicaid or the Healthy Michigan Plan (the state’s expanded Medicaid program) are able to receive annual flu vaccination without a copay.(7)Michigan Department of Community Health, MSA Bulletin 10-30 (Lansing, MI: Michigan Department of Community Health, Medical Services Administration, Aug. 10, 2010): https://michigan.fhsc.com/Downloads/ MSA_10-30_330003_7.pdf (accessed 8/20/15). The Healthy Michigan Plan encourages beneficiaries to choose vaccination by reducing annual out-of-pocket contributions by 50 percent for those with an annual household income above the federal poverty level who complete a Health Risk Assessment with their primary care office/clinic and identify a health behavior goal such as receiving a flu shot.(8)State of Michigan, Healthy Michigan Plan, MI Health Account (Lansing, MI: Healthy Michigan Plan, 2015): http://www.michigan.gov/healthymiplan/0,5668,7-326-67957_69564—,00.html (accessed 8/20/15). Because Healthy Michigan Plan beneficiaries whose income is below the federal poverty level are not required to make out-ofpocket contributions, many plans instead provide them with a $50 prepaid card or gift card for completing the Health Risk Assessment.(9)U nitedHealthcare, Healthy Michigan Plan – Health Risk Assessment
Provider FAQ’s (Southfield, MI: United Healthcare, April 2014): http://www.uhccommunityplan.com/content/dam/communityplan/healthcareprofessionals/providerinformation/MI-Provider-Information/MI_Healthy_Incentive_FAQ.pdf (accessed 8/20/15).,(10)HealthPlus Partners Healthy Michigan, HealthPlus Partners will reward you for taking steps toward getting and staying healthy! (N.P.: HealthPlus, April 8, 2014): https://www.healthplus.org/uploadedFiles/PDFs/Healthy_Michigan/HMP%20HRA%20Member%20Incentives%20Letter%20050514.pdf (accessed 8/20/15). As one of the Affordable Care Act’s preventive health services, annual flu vaccinations are also available without a copay or deductible to many Michiganders with private insurance.(11)U .S. Centers for Medicare & Medicaid Services, Preventive Health Services for Adults (Baltimore, MD: U.S. Centers for Medicare and Medicaid Services, N.D.): https://www.healthcare.gov/preventive-care-benefits/ (accessed 6/25/15). This brief examines the factors affecting flu vaccination in Michigan and how current and future policy initiatives could improve vaccination rates.
The brief is based on data from the Center for Healthcare Research & Transformation’s 2014 Cover Michigan Survey of Michigan adults, fielded between September and November 2014. All reported differences are statistically significant at the p ≤ 0.05 level.
Key Findings
- Less than half (45 percent) of Michigan adults surveyed reported having received a flu vaccination in the past 12 months, a proportion similar to the national average.
- Only 37 percent of African-American respondents reported having been vaccinated against the flu in the 12 months prior to the survey, compared to 47 percent of white respondents.
- Women were more likely than men to report having received the flu vaccine: 48 percent of women reported having been vaccinated as compared to only 42 percent of men.
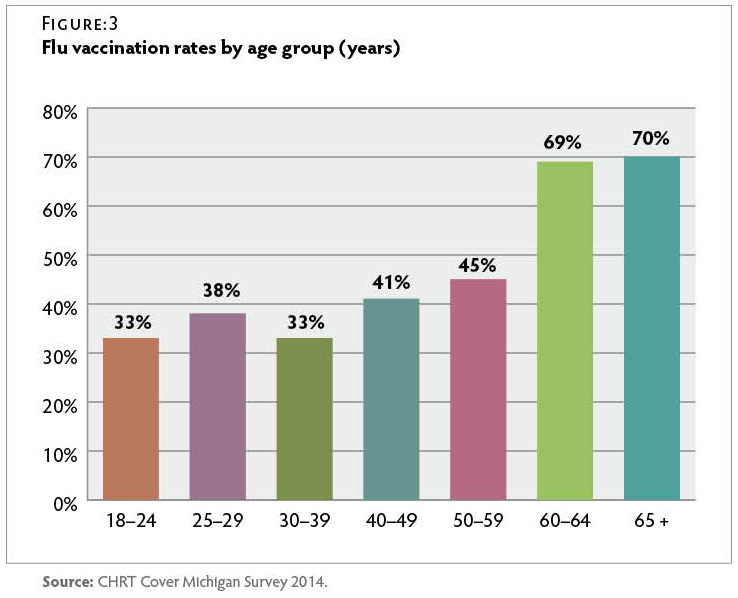
- About one in three respondents under the age of 40 (34 percent) reported having been vaccinated, compared to more than two-thirds (70 percent) of those over 65.
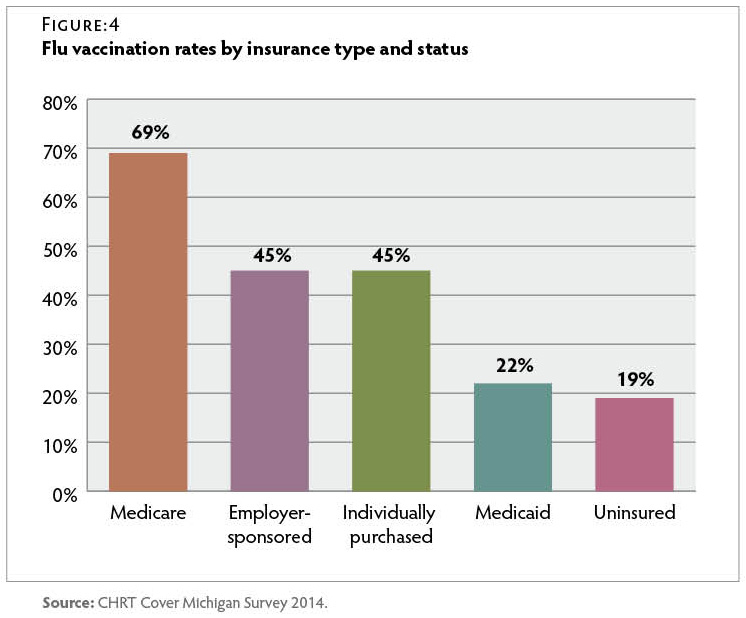
- Only 22 percent of respondents with Medicaid and 19 percent of uninsured respondents reported having received the flu vaccine in the past 12 months, about half the rate of respondents with employer-sponsored or individually purchased insurance.
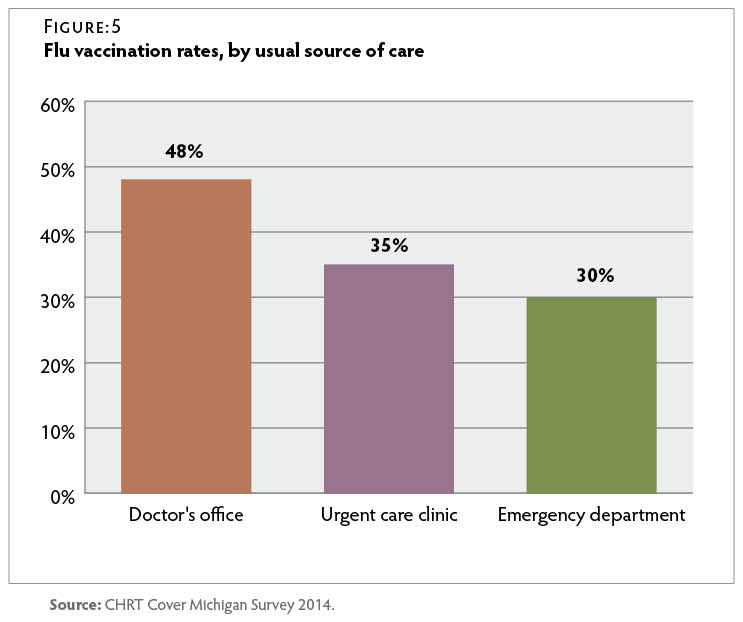
- Forty-eight percent of respondents who usually sought care at a doctor’s office reported having been vaccinated, compared to only 35 percent of those whose usual source of care was an urgent care clinic and 30 percent of those whose usual source of care was an emergency department.
Demographic Predictors of Vaccination
Forty-five percent of Michigan residents surveyed reported having received a flu vaccination in the 12 months before the survey. Forty-seven percent of white respondents reported having been vaccinated in the year leading up to the survey, compared to only 37 percent of African-American respondents.
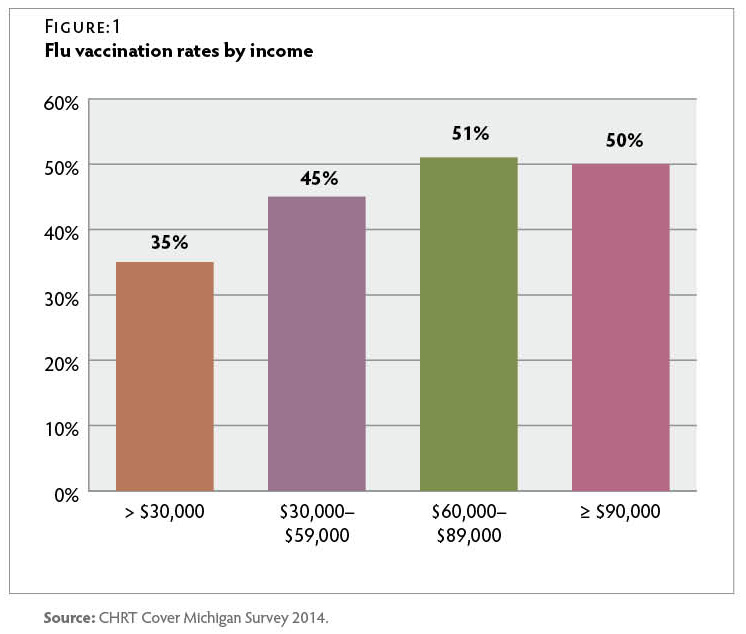
Only one-third of those whose income was less than $30,000 had been vaccinated, compared to half of those with an income above $30,000. Figure 1
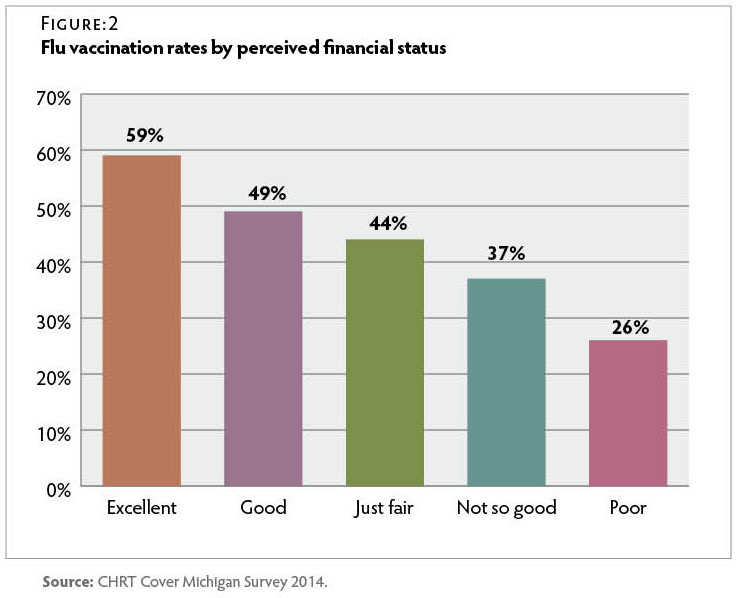
Perceived household financial status had an even stronger relationship with flu vaccination than did reported household income. Those who rated their household financial status as “excellent” were more than twice as likely to report having received a flu shot than were those who rated their household financial status as “poor.” Figure 2
Michiganders over the age of 65 were twice as likely to report having received a flu vaccine as those under 40. Only 34 percent of those between the ages of 18 and 39 reported having been vaccinated in the past year. Figure 3
Insurance Status and Vaccination
Survey respondents reported wide variations in vaccination rates varied based on insurance status. Only 19 percent of uninsured respondents reported that they had been vaccinated in the past year, compared to 48 percent of insured respondents. Michiganders with Medicare were most likely to report having received the flu vaccine, while those who were uninsured or had Medicaid were least likely to report having been vaccinated. Respondents with employer-sponsored or individually purchased insurance were almost twice as likely as those with Medicaid to report having received a flu vaccine. Less than one-quarter of respondents with Medicaid reported having been vaccinated in the 12 months prior to the survey. Figure 4
Source of Care and Vaccination
Half of Michiganders who reported that they had a primary care provider received a flu vaccine, compared to only 28 percent of respondents who did not have a primary care provider. Those who reported that they usually went to a doctor’s office when they were sick or needed medical advice were more likely to have been vaccinated than those who reported usually receiving care at an emergency department or urgent care clinic. Figure 5
Conclusion
Despite recommendations that all individuals six months and older be vaccinated against the flu each year, less than half of Michigan adults surveyed reported having been vaccinated in the year leading up to this survey. Michigan residents whose income was less than $30,000 per year, those without a primary care provider and/or who relied on urgent care facilities or emergency departments for care, and those who had Medicaid or were uninsured were least likely to have been vaccinated. The low vaccination rates among these groups suggest a need for targeted future interventions. These data were collected too early in 2014 to fully reflect vaccination rates during the 2014–2015 flu season and therefore do not assess effectiveness of the Healthy Michigan Plan’s potential to effect changes in vaccination rates. It is possible that Michigan vaccination rates may increase as more Michiganders gain insurance coverage through the Medicaid expansion and the insurance marketplace, and as participation in the Healthy Michigan Plan’s incentive program expands.
Methodology
The survey data presented in this brief were produced from a series of survey questions added to the Michigan State University Institute for Public Policy and Social Research (IPPSR) quarterly State of the State Survey. The survey was fielded between September and November 2014 and included a sample of 1,002 Michigan adults, with a 20.2 percent response rate. The margin of error for the entire sample was ±3.9 percent. The sampling design, a random stratified sample based on regions within the state, was a telephone survey of Michigan residents conducted via landline and cellular phones.
For analytical purposes, survey data were weighted to adjust for the unequal probabilities of selection for each stratum of the survey sample (for example, region of the state, listed vs. unlisted telephones). Additionally, data were weighted to adjust for non-response based on age, gender, and race according to population distributions from 2009–2013 American Community Survey data. Respondents who reported both Medicare and Medicaid coverage or who reported coverage through the Healthy Michigan Plan were considered Medicaid recipients for the purpose of this analysis. Due to the timing of the survey, reported vaccination may have occurred during either the 2013–2014 flu season or during the 2014–2015 flu season. Results were analyzed using SAS 9.3 software. Statistical significance of bivariate relationships was tested using z tests or chi-square tests for independence. All comparison tables are statistically significant at the p ≤ 0.05 level unless otherwise noted. A full report of the IPPSR State of the State Survey methodology can be found at: http://ippsr.msu.edu/soss/.
Suggested Citation: Mary L. Smiley, Melissa Riba, and Marianne Udow-Phillips, Flu Vaccination in Michigan:
Opportunities for Improvement. Cover Michigan Survey 2014 (Ann Arbor, MI: Center for Healthcare Research & Transformation, October 2015).
Acknowledgements: The staff at the Center for Healthcare Research & Transformation would like to thank Thomas Buchmueller, Matthew M. Davis, Robert Goodman, Helen Levy, Renuka Tipirneni, and the staff of the Institute for Public Policy and Social Research (IPPSR) at Michigan State University for their assistance with the design and analysis of the survey.
References
| ↑1 | Centers for Disease Control and Prevention, “Estimates of Deaths Associated with Seasonal Influenza — United States, 1976–2007,” Morbidity and Mortality Weekly Report (MMWR), Aug. 27, 2010, 59(33): 1057–62: http://www.cdc.gov/mmwr/preview/mmwrhtml/mm5933a1.htm (accessed 6/25/15) |
|---|---|
| ↑2 | Michigan Department of Health & Human Services, “Influenza Surveillance Report for the Week Ending June 13, 2015,” MI Flu Focus, Influenza Surveillance Updates, (Lansing, MI: Michigan Department of Health & Human Services, Bureaus of Epidemiology and Laboratories, June 24, 2015), 12(23): http://www.michigan.gov/documents/mdch/MIFF_6-24-15_492747_7.pdf (accessed 6/25/15). |
| ↑3 | Centers for Disease Control and Prevention, Advisory Committee on Immunization Practices (ACIP) Reaffirms Recommendation for Annual Influenza Vaccination (Atlanta, GA: CDC, Feb. 26, 2015): http://www.cdc.gov/media/releases/2015/s0226-acip.html (accessed 6/25/15). |
| ↑4 | Centers for Disease Control and Prevention, Flu Vaccination Coverage, United States, 2013–14 Influenza Season (Atlanta, GA: CDC, September 14, 2014): http://www.cdc.gov/flu/fluvaxview/coverage-1314estimates.htm (accessed 9/1/15). |
| ↑5 | Centers for Disease Control and Prevention, 2013–14 State, Regional, and National Vaccination Report II (Atlanta, GA: CDC, N.D.): http://www.cdc.gov/flu/fluvaxview/reportshtml/reporti1314/reportii/index.html (accessed 9/1/15). |
| ↑6 | Centers for Disease Control and Prevention, “Early Estimates of Seasonal Influenza Vaccination Effectiveness—United States, January 2015,” Morbidity and Mortality Weekly Report (MMWR), Jan. 16, 2015, 64(01): 10–15: http://www.cdc.gov/mmwr/preview/mmwrhtml/mm6401a4.htm (accessed 6/25/15). |
| ↑7 | Michigan Department of Community Health, MSA Bulletin 10-30 (Lansing, MI: Michigan Department of Community Health, Medical Services Administration, Aug. 10, 2010): https://michigan.fhsc.com/Downloads/ MSA_10-30_330003_7.pdf (accessed 8/20/15). |
| ↑8 | State of Michigan, Healthy Michigan Plan, MI Health Account (Lansing, MI: Healthy Michigan Plan, 2015): http://www.michigan.gov/healthymiplan/0,5668,7-326-67957_69564—,00.html (accessed 8/20/15). |
| ↑9 | U nitedHealthcare, Healthy Michigan Plan – Health Risk Assessment Provider FAQ’s (Southfield, MI: United Healthcare, April 2014): http://www.uhccommunityplan.com/content/dam/communityplan/healthcareprofessionals/providerinformation/MI-Provider-Information/MI_Healthy_Incentive_FAQ.pdf (accessed 8/20/15). |
| ↑10 | HealthPlus Partners Healthy Michigan, HealthPlus Partners will reward you for taking steps toward getting and staying healthy! (N.P.: HealthPlus, April 8, 2014): https://www.healthplus.org/uploadedFiles/PDFs/Healthy_Michigan/HMP%20HRA%20Member%20Incentives%20Letter%20050514.pdf (accessed 8/20/15). |
| ↑11 | U .S. Centers for Medicare & Medicaid Services, Preventive Health Services for Adults (Baltimore, MD: U.S. Centers for Medicare and Medicaid Services, N.D.): https://www.healthcare.gov/preventive-care-benefits/ (accessed 6/25/15). |